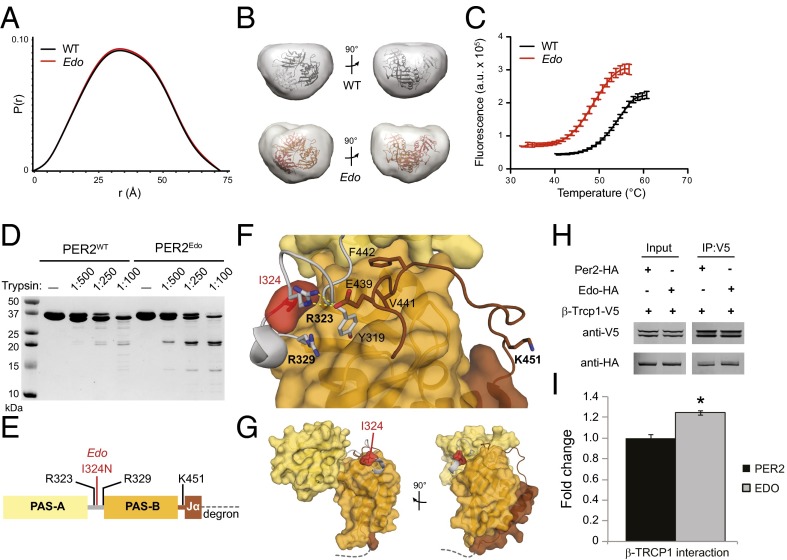
Fig. 3.
PER2Edo mutation increases flexibility of the interdomain linker to destabilize the PAS domain core. (A) SAXS pairwise distribution curves for the PAS-AB dimer of PER2WT (black) or PER2Edo (red). (B) Envelopes calculated from SAXS data for PER2WT and PER2Edo PAS-AB dimers fitted with the crystal structure (Protein Data Bank ID code 3GDI). (C) Thermal denaturation curves of purified proteins in the presence of SYPRO Orange dye (Sigma–Aldrich). Mean fluorescence (n = 6 from one representative experiment) is shown with SD error bars. Tms derived from nonlinear regression: PER2WT, 54.6 ± 0.4 °C; PER2Edo, 49.4 ± 0.3 °C. a.u., arbitrary units. (D) Limited proteolysis of His6-tagged proteins with indicated ratios of trypsin (wt/wt) for 1 h at room temperature. Cleavage products were resolved by 18% SDS/PAGE and visualized by Coomassie staining. (E) Schematic of the PER2 PAS-AB domain region with trypsin cleavage sites determined by liquid chromatography/MS. The dashed line represents the phosphodegron immediately downstream of the Jα helix. (F) Close-up view of the interdomain and Jα helix linkers in the PER2 PAS-AB domain core. Domain coloring is as in E; trypsin cleavage sites detected by liquid chromatography/MS are shown in bold. (G) Relationship of PAS domains, Edo and Jα helix to the PER2 phosphodegron (dashed line). (H) Representative Western blots of lysates (Input) from HEK293 cells transfected with either WT (Per2) or mutant (Edo) PER2-HA and V5-tagged TRCP1 immunoprecipitated (IP) with an Ab to V5. (I) Relative differences in protein interactions were determined by normalizing the amount of coimmunoprecipitated proteins to the amount of the primary precipitated protein. Values represent the mean ± SEM of four independent experiments (*P < 0.05, t test).

