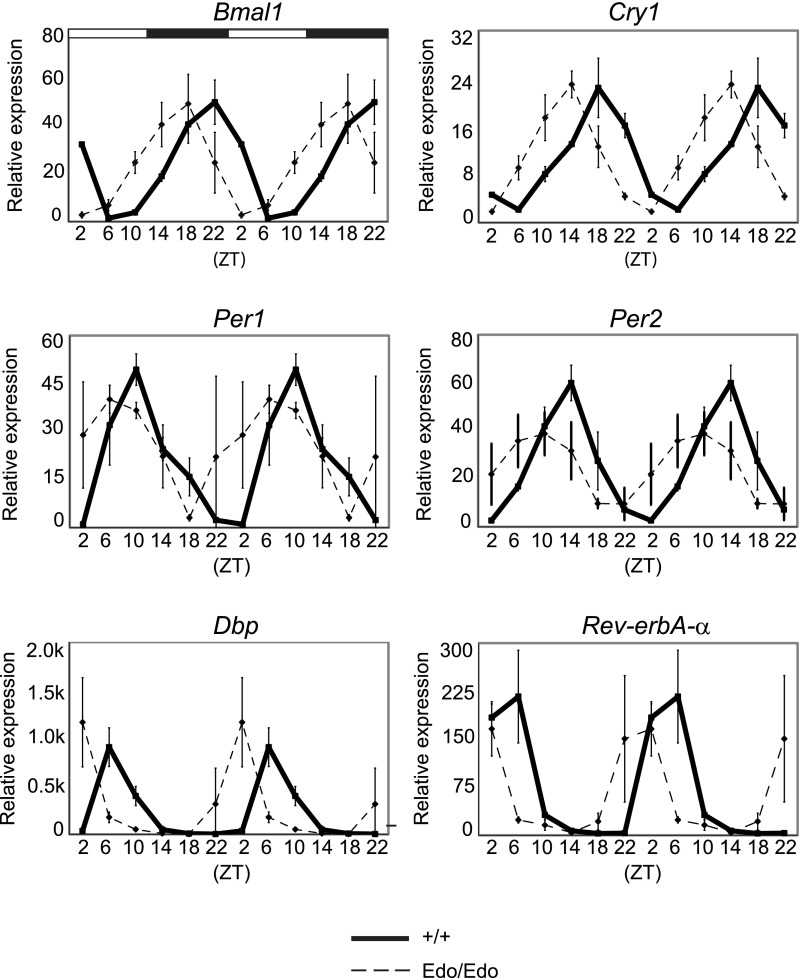
Fig. S1.
Circadian gene expression in the liver of Per2+/+ and Per2Edo/Edo mice. Relative expression of core oscillator and clock-controlled genes in Per2+/+ (solid lines) or Per2Edo/Edo (dashed lines) in ex vivo liver samples collected at six time points across the 12-h L/D cycle. Each value represents the mean ± SEM (n = 3 independent samples). Graphs are double-plotted for clarity. ZT, Zeitgeber time.

