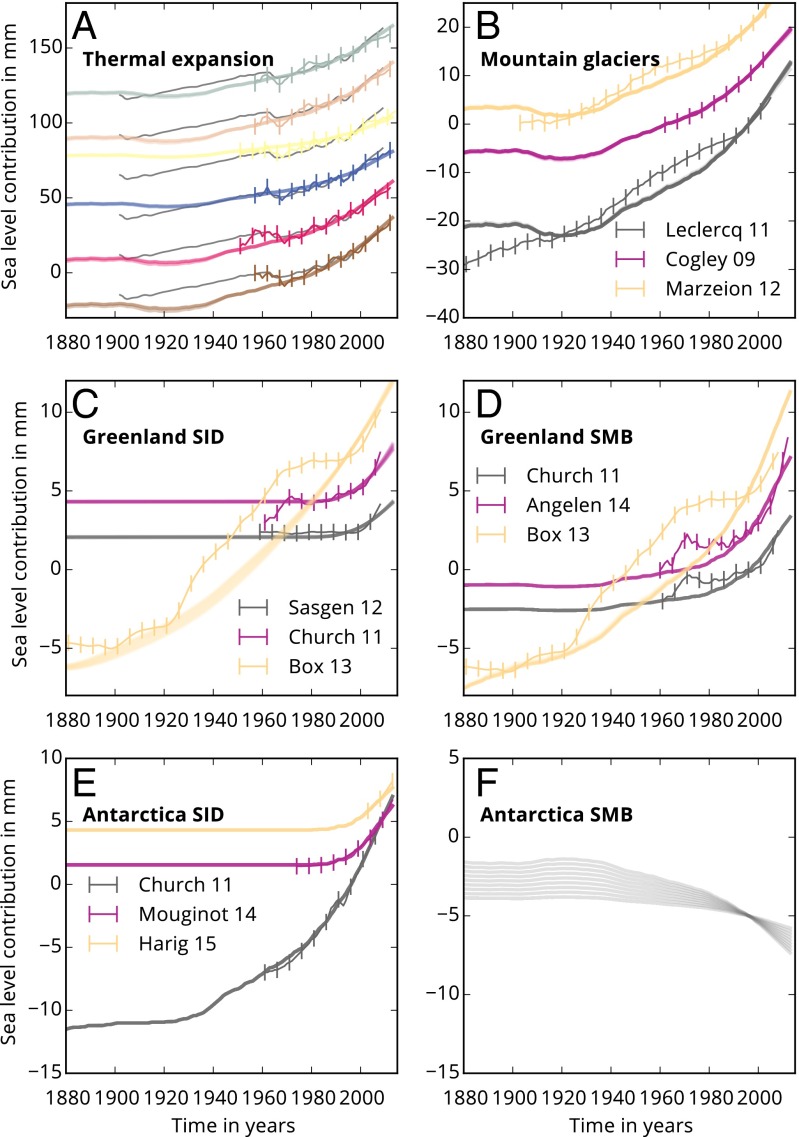
Fig. 1.
Observed and calibrated sea level contributions. Observed (lines with bars) and calibrated sea level contribution (lines) during the calibration period for each sea level component. (A) Combinations of upper, middle, and deep ocean thermal expansion (12–15); only subset of all combinations shown; see Fig. S2 for full set. Gray lines show CMIP5 model mean (1). (B) Anthropogenic mountain glacier loss (18–20). (C) Greenland SID (26–28). (D) Greenland SMB (24–26). (E) Antarctic SID (26, 39, 40). The Antarctic SMB contribution (F) is not calibrated, and is provided here for comparison. All observations and calibrated contributions are relative to the 1986–2005 mean. An offset is applied between datasets for better visibility. The y axis scale varies between panels.

