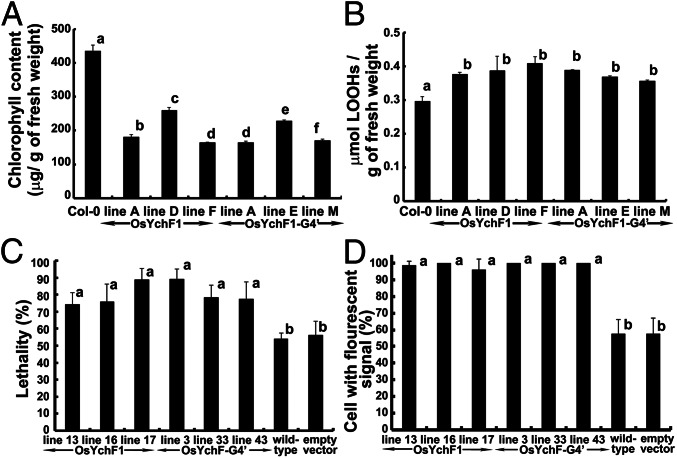
Fig. 5.
The ectopic expression of both OsYchF1 and OsYchF1-G4′ reduced the tolerance toward salinity stress. (A and B) The chlorophyll content (A) and the degree of lipid peroxidation (B) were examined by using 10-d-old OsYchF1- or OsYchF1-G4′-transgenic Arabidopsis seedlings further grown on MS agar medium supplemented with 150 mM NaCl for 14 d. All of the transgenic lines showed significantly different results from Col-0 in both sets of experiments, but the difference between the OsYchF1 and the OsYchF1-G4′ transgenic lines was either not significant (B) or inconclusive (A) (one-way ANOVA, P < 0.05). (C and D) Using transgenic BY-2 cells, cell viability (C), indicated by Trypan blue staining, and ROS contents (D), monitored by the florescent dye H2DCFDA, were used as stress parameters. Independent OsYchF1 (lines 13, 16, and 17) and OsYchF1-G4′ (lines 3, 33, and 43) transgenic BY-2 cell lines were compared with the wild-type cell line and the transgenic cell line containing the empty vector. The percentage of dead cells and florescence signals were minimal without NaCl treatment. Upon NaCl treatment, the percentages of dead cells and of cells with fluorescent signals from all six transgenic lines expressing either the OsYchF1 or the OsYchF1-G4′ recombinant constructs were significantly higher than the wild-type cell line and the transgenic line with the empty vector (one-way ANOVA, P < 0.05). Values with the same letter (a or b) are not significantly different. All experiments were performed twice, and similar results were obtained. For A and B, at least three sample sets (at least two seedlings each) were collected. For C and D, the number of cells counted were >80 and >40, respectively (each data point representing counts from at least six photos).

