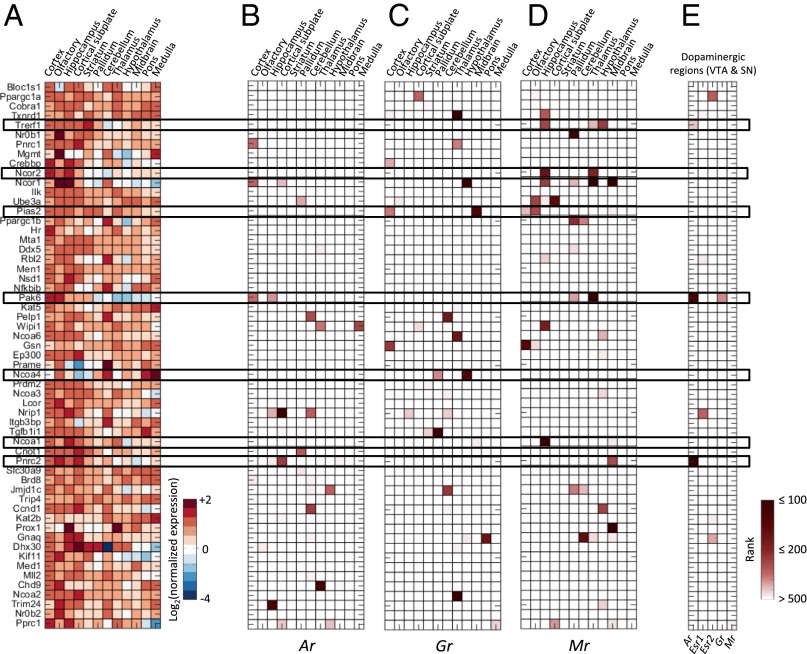
Fig. 4.
Coexpression of coregulators and steroid receptors. (A) Expression of 62 coregulators in 12 brain regions. Reported values are the average expression energy per region normalized to the average expression across the whole brain and then log2-transformed. Coexpression ranks of the 62 coregulators with Ar (B), Gr (C), and Mr (D). Dark red corresponds to high rank (i.e., strong coexpression). (E) Rank sum of the coexpression rank of each coregulator with Ar in the dopaminergic regions (VTA and SN).

