
Figure 7.
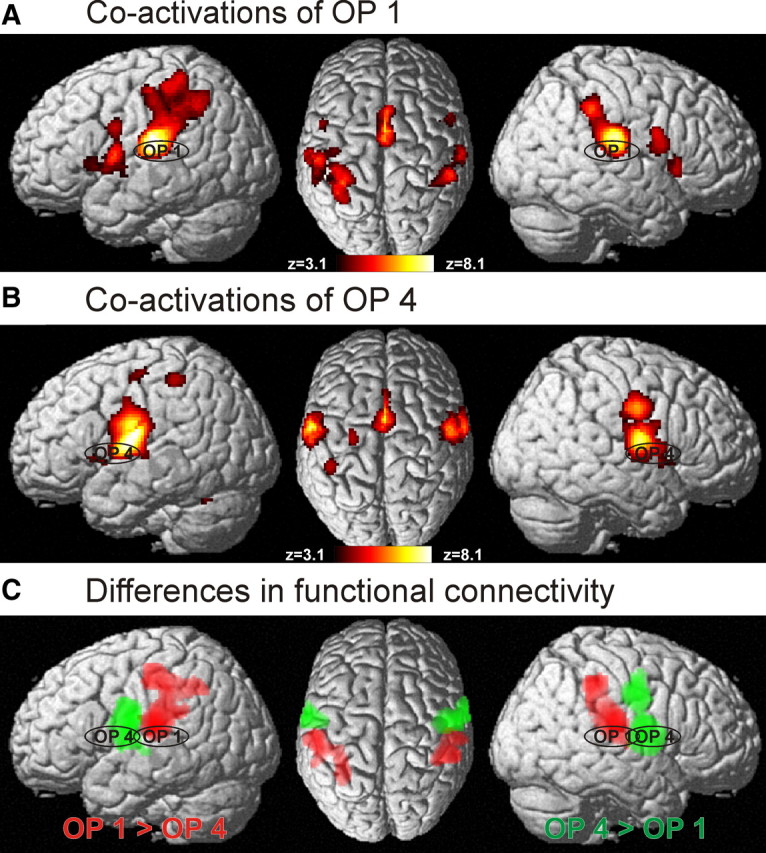
A, Functional connectivity of area OP 1 as delineated by the significant coactivation pattern obtained in a meta-analysis of the 80 studies activating only this area. As in Figure 6, the color scale ranging from deep red to white-yellow indicates the strength of the effects (z-score of the statistical analysis; all indicated voxels were significantly coactivated at p < 0.05, cluster level corrected). B, Functional connectivity of area OP 4 as delineated by the significant coactivation pattern obtained in a meta-analysis of the 61 studies activating only this area. Again, the color scale indicates the statistical effect size. C, Regions showing significant difference in functional connectivity between areas OP 1 and OP 4. Red indicates those voxels that were significantly more often coactivated with OP 1 as compared with OP 4; voxels shown in green denote those regions that showed significantly higher probabilities of coactivating with OP 4 than with OP 1. All data shown at p < 0.05, corrected.