
Figure 3.
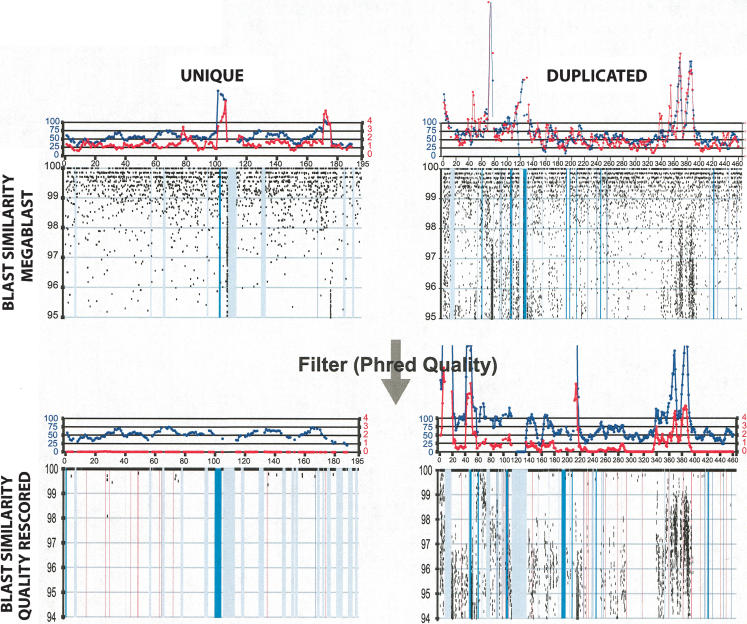
Examples of whole-genome shotgun sequence detection (WSSD). The calibration of our WSSD method was performed on a set of unique and duplicated sequences. Unique sequences were drawn from clones shown to be unique by both metaphase and interphase FISH (e.g., AL590991). Examples of duplicated sequence were drawn from recently described pericentromeric duplications (e.g., mmu5; Thomas et al. 2003). Detection parameters were optimized to differentiate unique from duplicated sequence. Black dots represent the similarity and position of individual sequence reads. Masked repetitive regions (LINE elements, purple; ERV elements, green; and simple sequence repeats, red) are shown as vertical bars. From previous studies of the human genome (Bailey et al. 2002a), read depth (blue line) provided the measure for duplication detection. Here, we also took advantage of the reduced level of allelic variation within the C57BL/6J strain to increase our power. Thus, single base-pair differences most likely signify either paralogous sequence or sequencing errors. By excluding errors (through the calculation of read identity using only high quality base positions), we could categorize each read as allelic (≥99.8% identity) or paralogous (<99.8% identity). Regions showing a divergent read ratio (red line) of >0.8 (paralogous: allelic) were deemed duplicated. A divergent read ratio of 1 would suggest one paralogous copy.