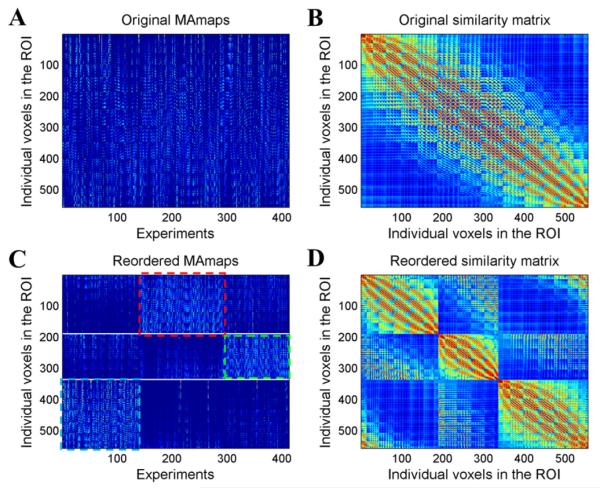
Fig. 2.
Original and reordered MA maps and similarity matrix for the left amygdala. (A) Original MA maps. (B) Original similarity matrix. (C) Reordered MA maps. From top to bottom, each row represents a voxel in the ROI in the order of cluster 1, cluster 2, and cluster 3. From left to right, each column represents an experiment in the order of the grouped three subsets of the experiments. (D) Reordered similarity matrix.

