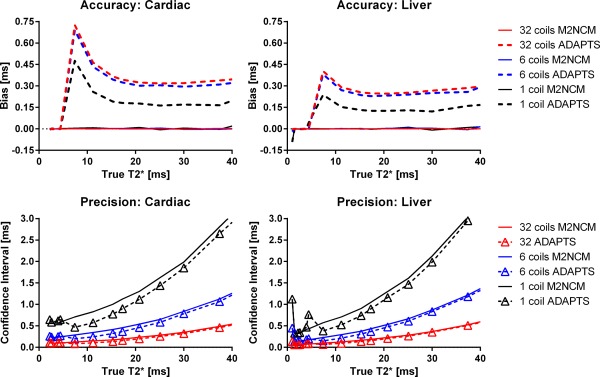
Figure 2.

Accuracy and precision in numerical simulations. Solid lines indicate the M2NCM method and dashed lines show ADAPTS. Number of simulated coils are color‐coded. The upper panels show Accuracy in terms of mean differences between true T2* values, shown on the x‐axes. The lower panels show CIs from all simulation experiments (2000 repetitions), for each simulated T2* value. Within the clinically relevant range, the proposed method results in high accuracy and precision. The gradual decrease in precision with increasing T2* is most likely attributed to lack of available data‐points above 25 ms and 20 ms for cardiac and liver TEs, respectively, and is also seen in the near‐optimal noise‐corrected method. Simulated ROI size was 40 pixels.
