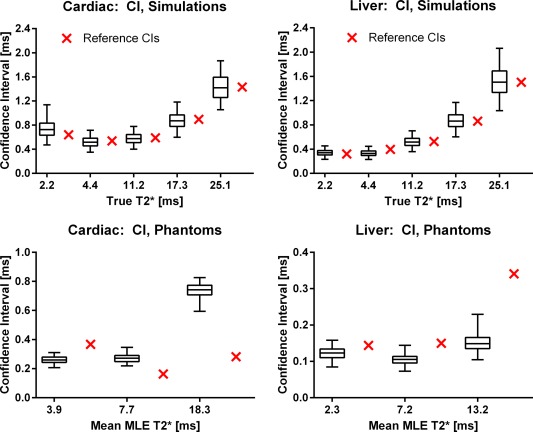
Figure 3.

Box‐whiskers plots of the ADAPTS uncertainty estimate validation in simulations (top row) and repeated phantom measurements (bottom row). Simulations: 2.5% (bottom whiskers) and 97.5% (top whiskers) confidence limits from 2000 ADAPTS CI estimates in numerical simulations compared with the CIs obtained from the 2000 repetitions, shown as crosses directly to the right of each corresponding CI estimate. Boxes indicate first and third quartiles of the CI estimates and the horizontal line splitting the boxes shows the median. Note that the CI references (crosses outside boxes) all lie well within the confidence limits of the ADAPTS CI estimates for the simulated T2* values. Simulated ROI size was 40 pixels. Phantom study: 2.5% (bottom whiskers) and 97.5% (top whiskers) confidence limits from 120 ADAPTS CI estimations in repeated phantom scans, compared with the CIs calculated over all 120 repetitions (crosses directly to the right of the corresponding CI estimates). Limited overestimation and underestimation of CIs are observed.
