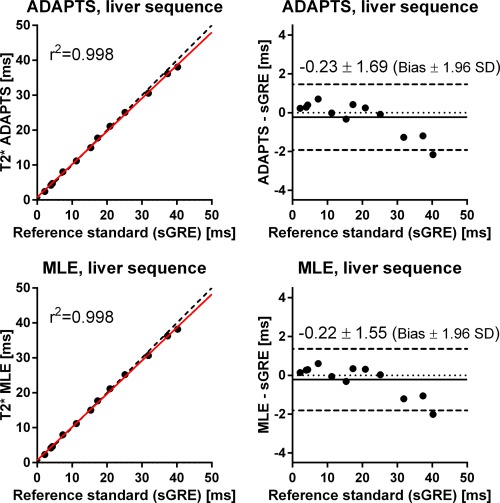
Figure 6.

Scatter plots (left) and difference plots (right) of T2* by ADAPTS (top) and MLE (bottom) using the clinical liver sequence compared with the T2* reference standard sGRE in phantoms. Scatter plots: solid lines indicate linear regression and dashed lines represent identity lines. Difference plots: Solid lines indicate bias and dashed lines represent bias ± 1.96 SD. T2* values by ADAPTS and MLE using the clinical liver mGRE sequence agree well with the reference standard sGRE over a wide range of T2* values.
