Figure 3.
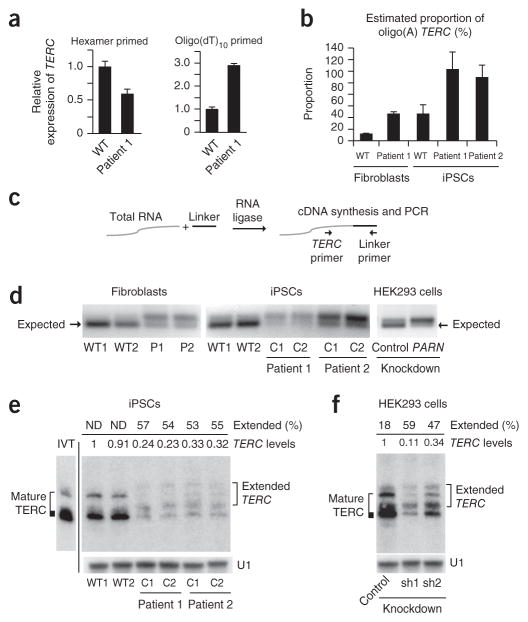
PARN deficiency results in abnormal TERC 3′ ends.
(a) qPCR of TERC transcripts in cDNA from normal and patient-derived fibroblasts generated using random hexamer versus oligo(dT)10 priming (n = 3 technical replicates). Error bars, s.d. (b) Estimated proportion of oligo(A)-containing TERC forms in fibroblasts and iPSCs (n = 2 technical replicates). Error bars, s.d. (c) The 3′ RACE strategy. A universal linker is ligated to the 3′ ends of total RNA. cDNA synthesis with a linker-specific primer followed by PCR using linker- and TERC-specific primers yields amplicons representing the diversity of TERC 3′ ends. (d) 3′ RACE products from normal and patient-derived fibroblasts (left) and iPSCs (middle) and from HEK293 cells subjected to shRNA-mediated knockdown of PARN versus luciferase (control) (right). Amplicons were separated by agarose gel electrophoresis; the expected size (184 bp) of mature TERC is indicated (arrows). (e) RNA blot of TERC using RNA from iPSCs, separated by denaturing 5% PAGE. U1 small nuclear RNA (snRNA) represents loading control. The migration pattern of in vitro–transcribed full-length TERC RNA is shown (IVT) and is considered to represent mature TERC. Extended TERC species found in patient-derived iPSCs are indicated on the right. Levels of total TERC species normalized to the levels in WT1 are shown. The percentage of extended forms in comparison to total TERC levels within each sample is indicated. Discrete, extended TERC species could not be distinguished in wild-type iPSCs (ND). (f) RNA blot (urea 5% PAGE) of TERC using RNA from HEK293 cells subjected to shRNA-mediated knockdown of PARN (sh) versus luciferase. Analysis was as described in e.

