Figure 5.
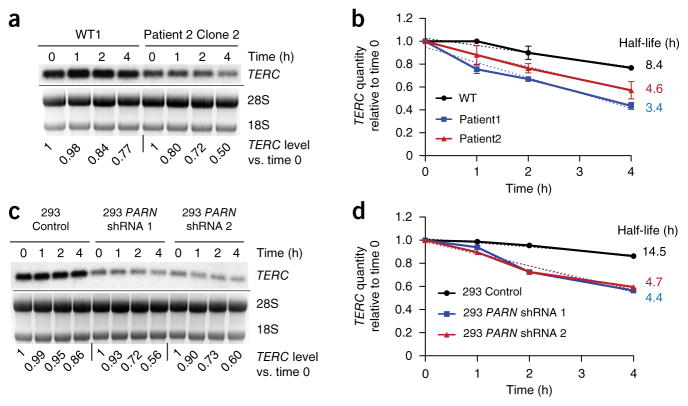
Decreased stability of TERC in PARN-deficient cells. (a) Representative RNA blot of TERC RNA levels in normal versus patient-derived iPSCs, at 0, 1, 2 and 4 h after the addition of actinomycin D. Results for WT1 and patient 2 clone 2 iPSCs are shown. Ethidium bromide staining of 28S and 18S rRNAs is shown; 18S rRNA was used as a loading control. TERC levels normalized to those at time 0 for each sample are indicated. (b) Graph of the TERC decay rate in normal and patient-derived iPSCs, calculated from RNA blot analysis as shown in a (n = 2 for each group; error bars, s.d.). The dotted lines reflect the slope determined by simple linear regression, and half-life is the calculated x intercept at y = 0.5. (c, d) RNA blot (c) and decay rates (d) of TERC RNA in HEK293 cells subjected to shRNA-mediated knockdown of PARN versus control. Quantification was performed as in a and b.

