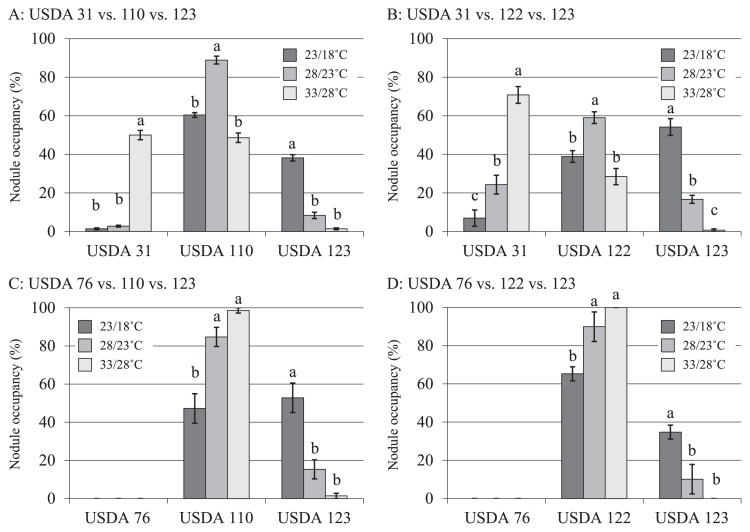
Fig. 2.
Rate of nodule occupancy by each test strain isolated from soil microcosm experiments using the indicated mixes of three strains. Values shown represent mean from three soybean cultivars, Akishirome, Bragg, and Orihime ± SE (n=3). Bars with the same superscript letters are not significantly different (Tukey HSD test) at P < 0.05.

