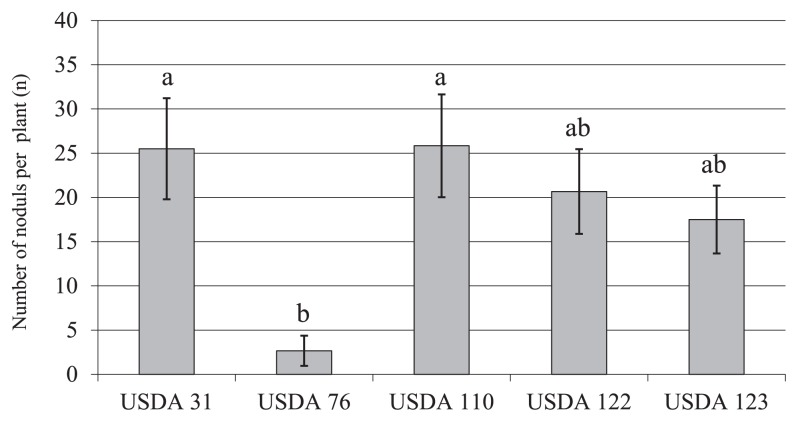
Fig. 3.
Number of nodules of each test strain on non-Rj genotype soybean. Values shown represent mean from total plant number of six ± SE. Three soybean cultivars, Akishirome, Bragg, and Orihime, were used each two individual. Bars with the same superscript letters are not significantly different (Tukey HSD test) at P < 0.05.

