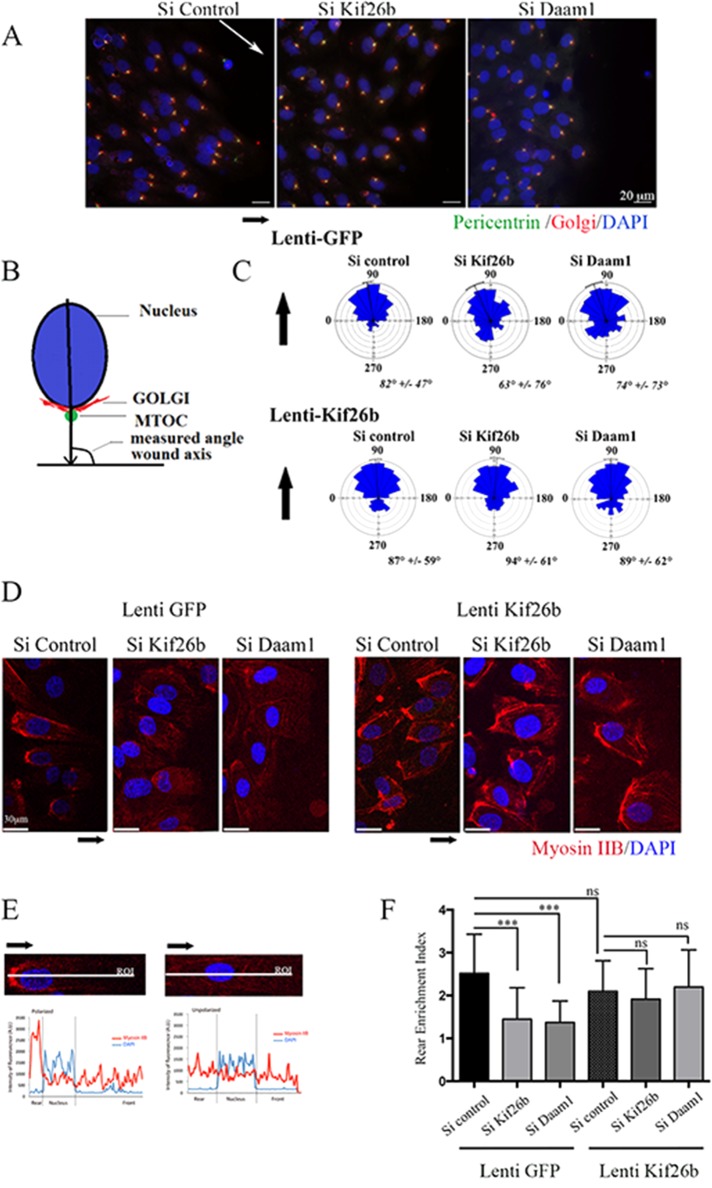
FIGURE 4:
Kif26b depletion impaired MTOC/Golgi and myosin IIB cell asymmetrical distribution in migrating ECs. (A) si Control, si Kif26b, or si Daam1 HUVECs were fixed and stained 6 h after wounding of a confluent monolayer in the presence of Wnt3a to induce cell migration. Nucleus, MTOC, and Golgi positions were examined by 4′,6-diamidino-2-phenylindole (DAPI; blue), pericentrin (green), and Golgi-97 (red) immunofluorescence. Scale bars, 50 μm. (B) Angles between the nucleus center/MTOC/Golgi axis and wound axis were measured to evaluate cell polarization. (C) Distribution of cell orientation angles in both lenti-GFP control and lenti-kif26b conditions in a rose plot. Bars and values denote mean ± circular SD; 200 cells from three experiments. (D–F) Knockdown of Kif26b (si Kif26b) and Daam1 (si Daam1) impaired myosin IIB cell rear enrichment in migrating cells, whereas Kif26b lentiviral transduction restored myosin IIB accumulation. (D) Cells were stained with anti–myosin IIB (red) and DAPI (blue) and imaged. Scale bars, 50 μm. (E, F) Asymmetrical rear enrichment of myosin IIB was assessed by analyzing the intensity values along the line drawn across the nucleus long axis and cell extension processes perpendicular to the wound line. Intensity profile curve per cell was then plotted, area under curve in the rear (AR) and front (AF) of the nucleus was calculated, and a rear enrichment index was determined (i = AR/AF). Bars denote mean ± SEM; ≥30 cells from three experiments. Statistical comparison between groups was performed using one-way ANOVA followed by Tukey’s test (p < 0.05) to detect differences between all groups. ***p < 0.001 by one-way ANOVA. ns, not significant.

