FIGURE 5:
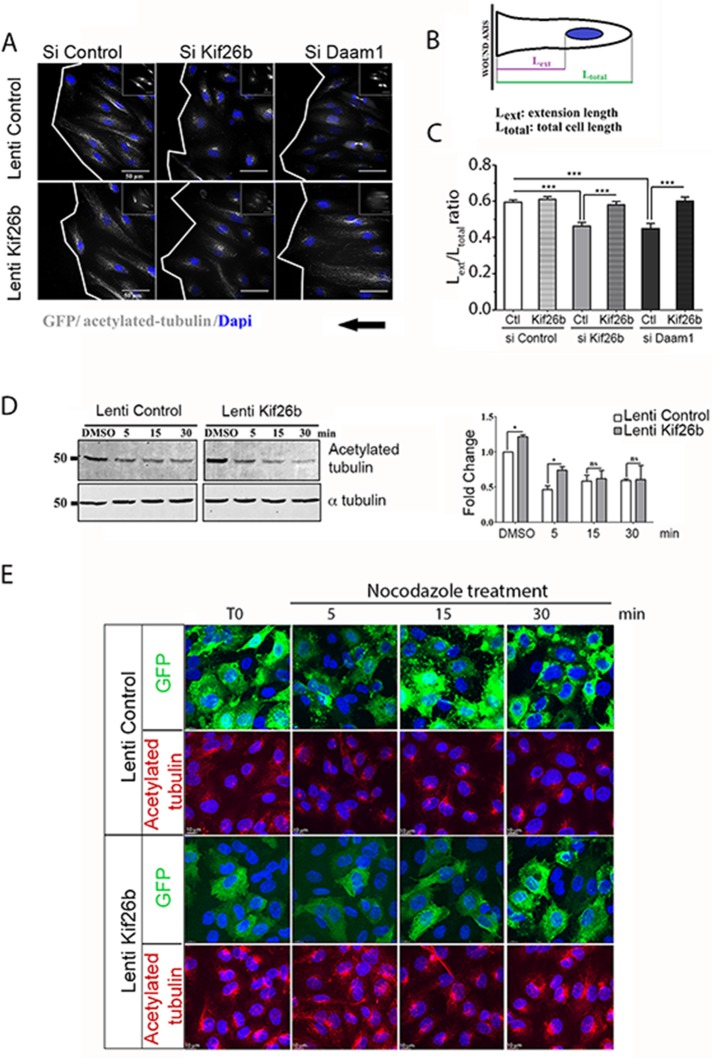
Kif26b induced a cell polarity axis through MT stabilization. (A–C) Kif26b and Daam1 knockdown decreased the ratio of cell extension length vs. control conditions. Restored Kif26b rescued the formation of polarized cell extension. (A) Si Control, si Kif26b, and si Daam1 HUVECs were subjected to wound-induced migration under Wnt3a stimulation. Cells were stained with anti–acetylated tubulin (gray) and DAPI (blue). Scale bars, 50 μm. White lines indicate wound edges. (B, C) Ratio of total cell length (LTOTAL) to extension length (LEXT), to analyze cell polarization toward the wound. Bars denote mean ± SEM; ≥30 cells from three experiments. Statistical comparison between groups was performed using one-way ANOVA followed by Tukey’s test (p < 0.05) to detect differences between all groups. ***p < 0.001 by one-way ANOVA. (D, E) Kif26b overexpression induced MT stabilization. (D) Control (GFP) or Kif26b-GFP lentivirus–transduced HUVECs were treated with either dimethyl sulfoxide or nocodazole (500 nM) for 5, 15, or 30 min; lysates were subjected to SDS–PAGE and Western blotting with anti–acetylated tubulin and anti–α tubulin antibodies (left). Quantification of fold change was calculated in relation to acetylated tubulin level in GFP-transduced HUVEC basal condition (right). Error bars denote mean ± SEM; three experiments. *p < 0.05, **p < 0.01 by one-way ANOVA followed by Tukey’s test. ns, not significant. (E) Nocodazole-treated cells were stained with GFP (green) or acetylated tubulin (red) and DAPI (blue) and imaged. Scale bars, 10 μm.

