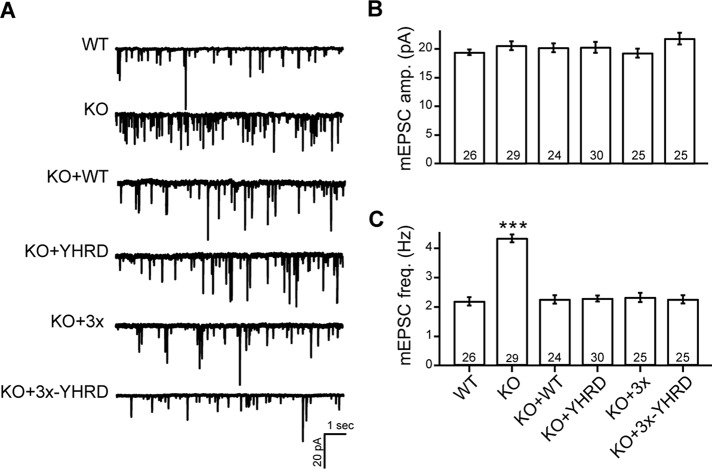
FIGURE 5:
Spontaneous release is unaffected by the YHRD mutations. (A) Representative mEPSC traces recorded from WT, syt-1 KO, and KO neurons expressing WT, YHRD, 3×, and 3×-YHRD mutant forms of syt-1. (B and C) Bar graphs showing mEPSC amplitude (pA; B) and frequency (Hz; C). The number of neurons in each group are indicated; plotted values represent the mean ± SEM. ***, p < 0.001.

