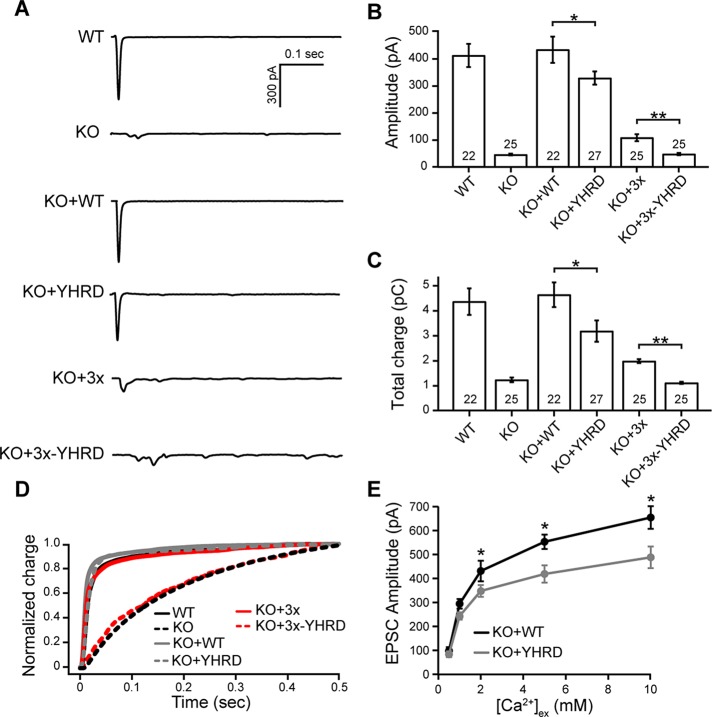
FIGURE 6:
The YHRD mutations decrease evoked neurotransmission in cultured hippocampal neurons. (A) Representative evoked EPSC traces recorded from WT, syt-1 KO, and KO neurons expressing WT, YHRD, 3×, and 3×-YHRD constructs. (B and C) Bar graphs of evoked EPSC amplitude (pA; B) and total charge (pC; C). The number of neurons in each group are indicated inside the bars. (D) Normalized cumulative total charge transfer, averaged for each group; a double exponential function was used to fit the data. (E) Representative evoked EPSCs recorded from KO neurons expressing WT or YHRD in the presence of the indicated extracellular Ca2+ concentration, [Ca2+]ex. There were 10–20 neurons analyzed per condition. All data represent mean ± SEM; *, p < 0.05; **, p < 0.01.

