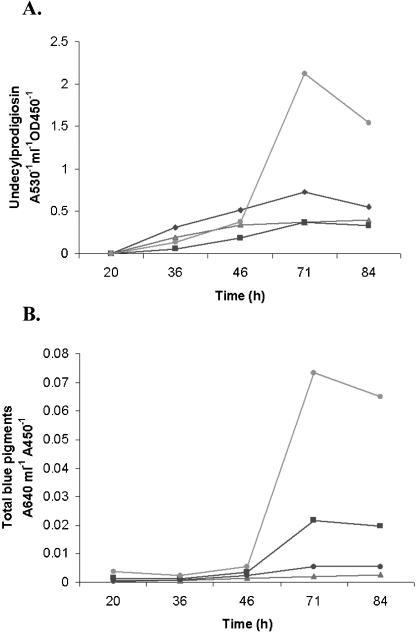
Figure 3.

Antibiotic overproduction by the S. coelicolor osaB mutant AB001. Graphs of yields (the average of three independent experiments; standard deviations were <5% of the plotted values) at indicated time-points of (A) actinorhodin and γ-actinorhodin, and (B) undecylprodigiosin relative to cell density (OD450) produced by submerged cultures grown in liquid R5 with or without 10.3% sucrose (S); (•) AB001 (+S); (▪) M145 (+S); (♦) AB001 (-S); (▴) M145 (-S).
