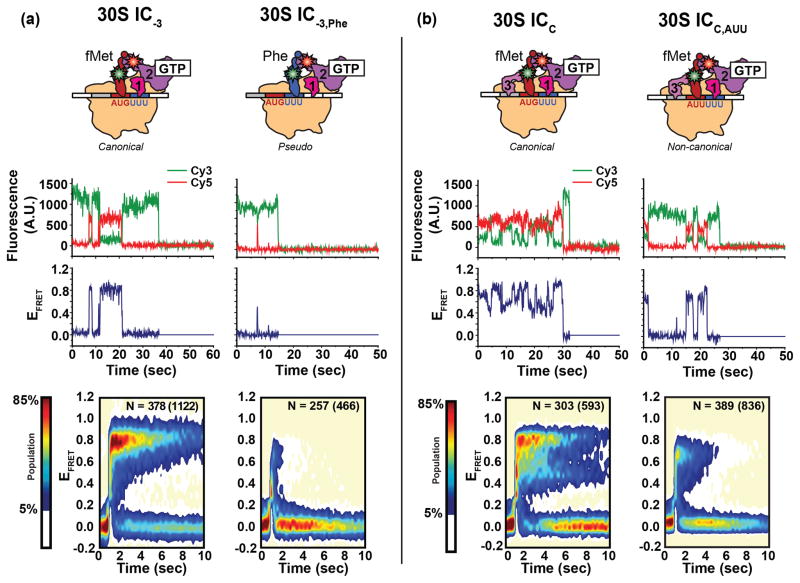
Figure 2.
Single-molecule FRET measurements of the IF2•tRNA sub-complex on the 30S IC. (a) Comparison of a canonical 30S IC lacking IF3 (left panel) carrying fMet-tRNAfMet base paired to the AUG start codon and the analogous pseudo 30S IC carrying the elongater Phe-tRNAPhe (right panel). (b) Comparison of a completely assembled canonical 30S IC (left panel) and the analogous non-canonical 30S IC formed on the near-start AUU codon (right panel). Cartoon representations of the 30S ICs (top row), representative fluorescence versus time trajectories and the corresponding FRET efficiency (EFRET) versus time trajectories (middle row), and post-synchronized surface contour plots of the time evolution of population FRET (bottom row) are shown for each 30S IC. Surface contour plots were constructed by superimposing all of the individual IF2 binding events. ‘N’ values indicate the total number of EFRET versus time trajectories obtained for each 30S IC; the number in parenthesis indicates the total number of IF2 binding events for all of the trajectories (N). Surface contour plots were plotted from the lowest (tan) to the highest (red) population as indicated in the population color bar. Figure adapted, with permission, from Wang et al.42.

