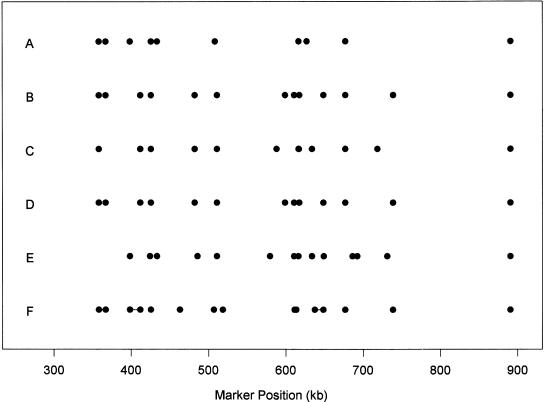
Figure 1.

The positions of the ending SNPs in blocks. (A–D) Genotype data are used. (A) α = 80%, β = 5%; (B) α = 80%, β = 10%; (C) α = 90%, β = 5%; (D) α = 90%, β = 10%; (E) α = 80%, β = 10% with the haplotype data. (F) The blocks reported in Daly et al. (2001), where lines indicate regions not in their blocks.
