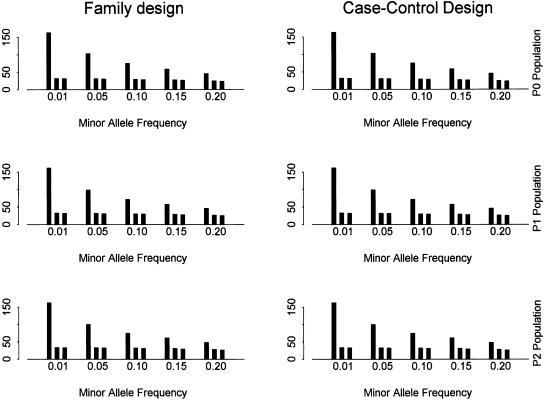
Figure 3.

The number of SNPs and tag SNPs for different minor allele frequencies with α = 80% and β = 10%. The SNP density is set as one SNP per kilobase. In each bin (i.e., for each minor allele frequency), it shows the number of (from left to right) (1) all SNPs for block partitioning and tag SNP selection; (2) tag SNPs identified by the haplotype data; (3) tag SNPs identified by the genotype data.
