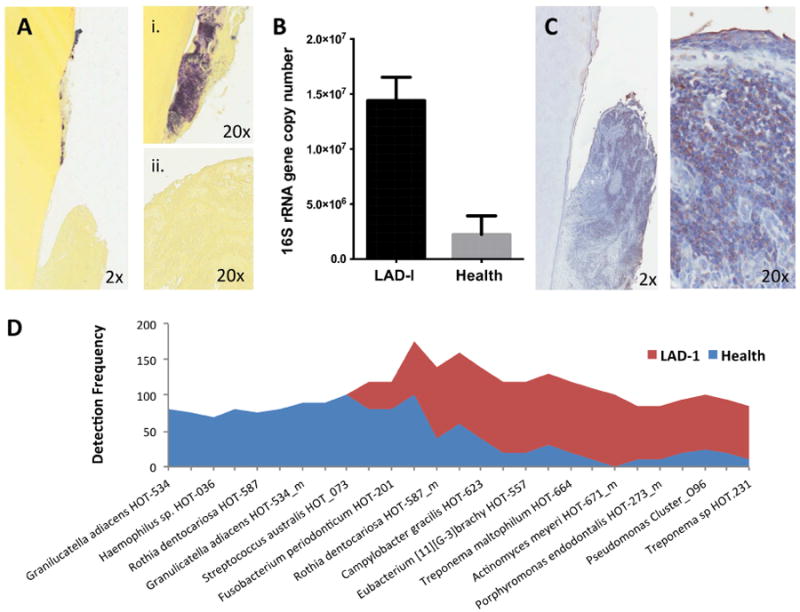
Fig. 3. Subgingival microbiome in LAD-I.

(A) Gram staining (Brown and Brenn) of extracted tooth (i) and adjacent soft tissues (ii) (2×-20× original magnification). (B) Total bacterial load (quantified with real-time PCR for 16S rRNA) for LAD-I and health. Bacterial load values are expressed as log (10) of 16S rRNA gene copy number (mean+SEM shown, p<0.05) [44]. (C) Immunohistochemistry for bacterial lipopolysaccharide (LPS) on extracted LAD tooth and surrounding tissues (2×-20× original magnification). (D) Highly prevalent taxa (species) in health and LAD-I. Detection frequency shown per group. From ref. [44]. Original, not previously published images were used in this review.
