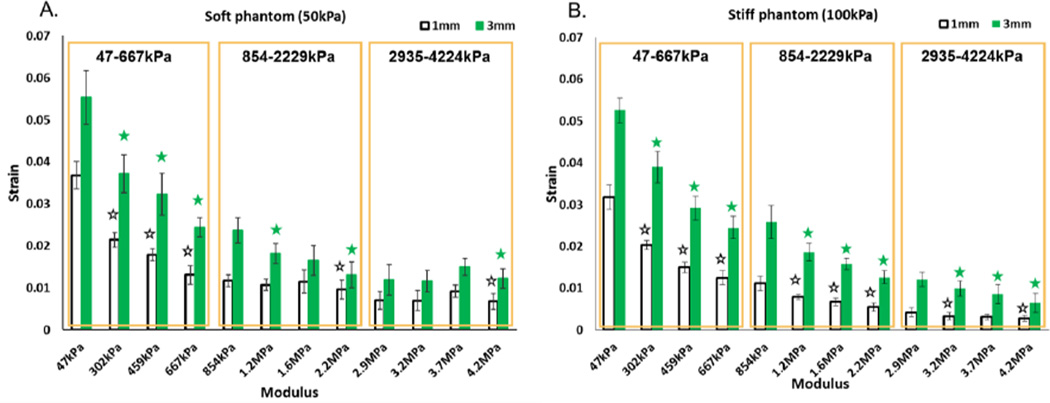
Figure 6.
Strain results from UE. A) Soft phantom (E=50kPa); B) Stiff phantom (E=100kPa). The boxes are illustrating three groups in which four PDMS samples are scanned together. The elastic modulus range is highlighted in each box. Statistically significant differences between successive samples (i.e. Sample 2 compared to Sample 1) were evaluated using a Tukey HSD test and are annotated with stars.

