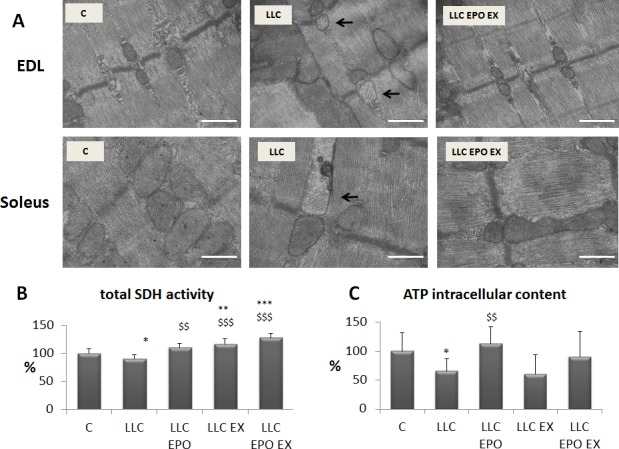
Figure 4. Exercise training and EPO restore mitochondrial morphology in LLC-bearing mice.

A. Transmission electron microscope images of EDL and soleus longitudinal sections, in control (C), LLC-bearing mice (LLC) and exercised EPO-treated (EX EPO). Black arrows indicate altered mitochondria. Scale bar = 500 nm. Quantification of SDH (succinate dehydrogenase) activity in tibilais B. and ATP intracellular content in gastrocnemius (GSN) muscle (C., expressed as % of control) of control (C) and LLC-bearing mice (LLC). LLC groups were subdivided in sedentary, EPO-treated (EPO), exercised (EX), and exercised EPO-treated (EX EPO). Significance of the differences: *p < 0,05 vs C, **p < 0,01 vs C, ***p < 0,001 vs C $$p < 0,01 vs LLC, $$$p < 0,001 vs LLC.
