
Figure 5. Exercise training and EPO regulate bioenergetics-related gene and protein expression in LLC-bearing mice.
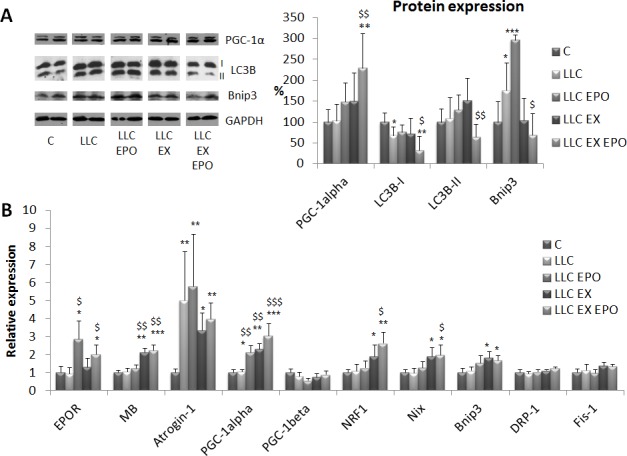
A. Protein expression analysis of PGC-1α, LC3B (either in native or lipidated form, -I and -II, respectively) and Bnip3 corrected for tubulin abundance in gastrocnemius (GSN) muscle of control (C) and LLC-bearing mice (LLC). LLC groups were subdivided in sedentary, EPO-treated (EPO), exercised (EX), and exercised EPO-treated (EX EPO). Data (mean±SD) expressed as % of controls. B. Gene expression analysis of EPOR, myoglobin (MB), Atrogin-1, PGC-1alpha, PGC-1beta, NRF1, Nix, Bnip3, DRP-1 and Fis-1 in the tibialis anterior muscle. Specific mRNA abundance was corrected for the mean of TBP (TATA box-binding protein) and β-actin levels on individual samples. Data (mean±SE) are compared by 2-way ANOVA. Significance of the differences: *p < 0,05 vs C, **p < 0,01 vs C, ***p < 0,001 vs C, $p < 0,05 vs LLC, $$p < 0,01 vs LLC, $$$p < 0,001 vs LLC.