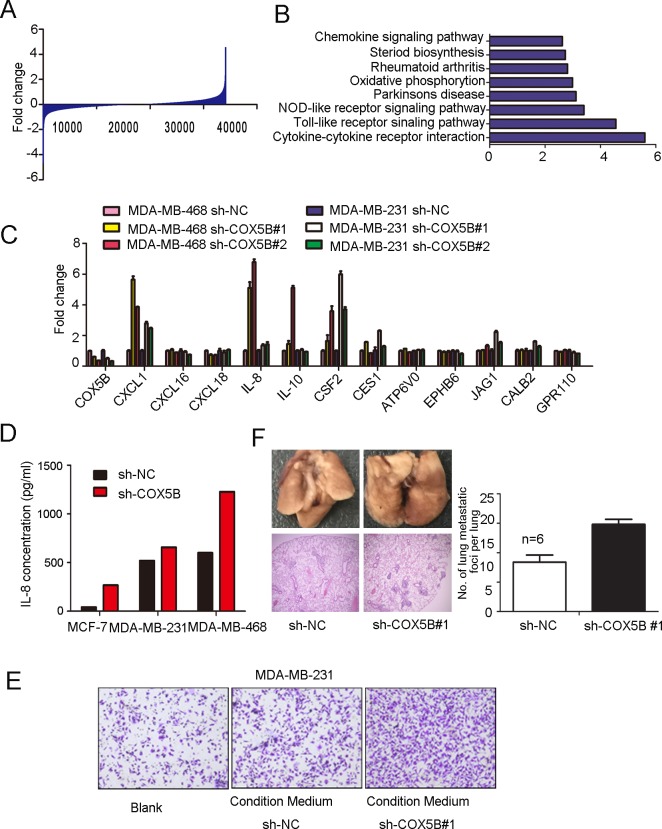
Figure 4. Loss of COX5B enhanced IL-8 and other associated cytokines releasing.
The entire genes obtained from microarray profile assay. (B) GO enrichment analyses of COX5B knockdown and control cells. (C) Real-time PCR validated the candidate genes. (D) IL-8 secretion analyzed by ELISA. (E) Migration assay of MDA-MB-231 induced by MDA-MB-231 sh-COX5B #1- and sh-NC-conditioned medium. (F) Left panel shows representative images for the lung metastatic nodules, the upper two photos show number of metastatic nodules in lungs surface indicated by red arrows and the lower ones display hematoxylin-eosin stained sections of lungs (magnification ×40). Right panel, quantification of the number of lung metastatic foci per lung, the number of foci was counted in three sections per lung under the microscope n=6 p<0.05.

