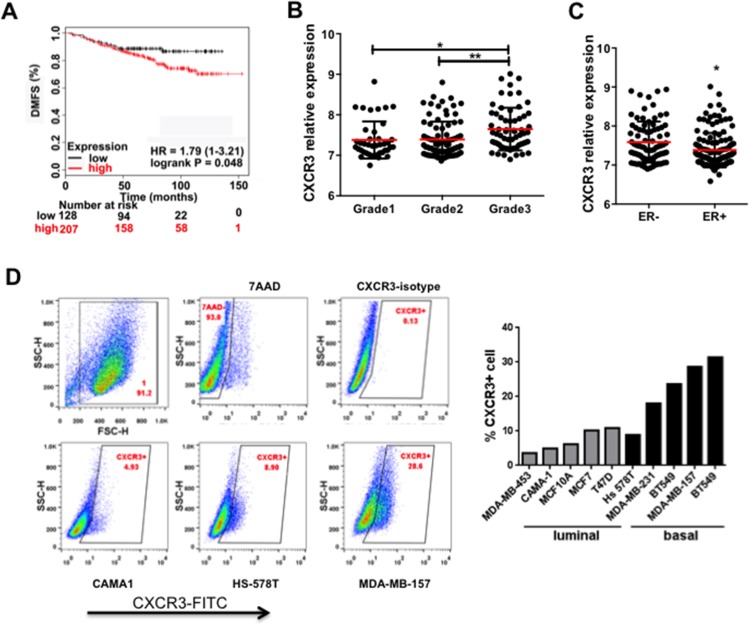
Figure 4. CXCR3 expression correlates with breast cancer progression and metastasis.
A. Kaplan-Meier survival curve for the correlation of CXCR3 expression level with distant metastasis-free survival of breast cancer patients (GEO database) [22]. The high or low CXCR3 expression was defined as above or below the average of CXCR3 expression in all patients. B. CXCR3 expression in breast cancer patients with different tumor grades (GSE22220). C. CXCR3 expression in ER – and ER + breast cancer patients (GSE22220). Breast cancer data sets were analyzed by GeneSpring GX 10.0 software. Data are represented as mean +/− SEM. *P < 0.05; **P < 0.01. D. Flow cytometry analysis of CXCR3 expression in a panel of human breast cancer cell lines. Representative samples are on the left; all data are in the bar figure on the right.

