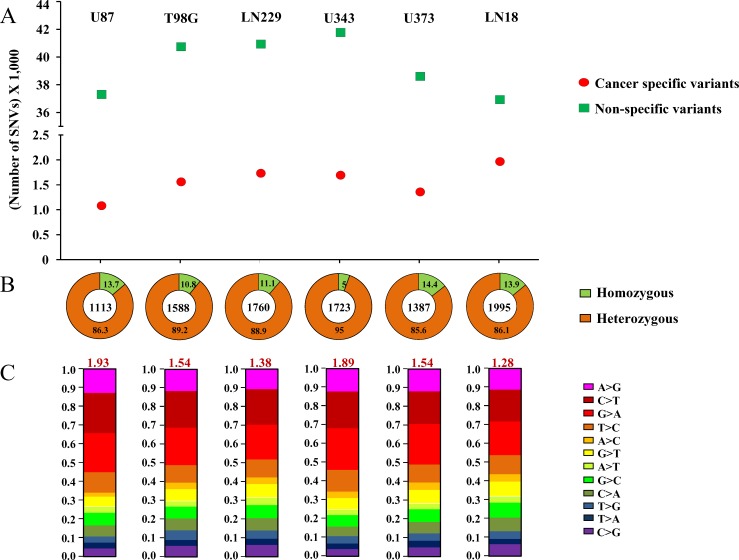
Figure 1. Cancer-specific mutation quality statistics.
A. Number of Cancer-specific versus non-specific SNVs. B.. Percentage of homozygous versus heterozygous changes. The numbers in each quadrant represent the percentage, and the number in the center of the circle represents the total number of cancer-specific mutations. C. Ti/Tv changes for each cell line's cancer-specific SNVs. Each type of base change has been given by different color codes and the overall Ti/TV ratio has been given in red font at the top of each bar-plot. For A., B. and C., plot for each cell line has been given in one column and the name of the cell line has been specified at the top.

