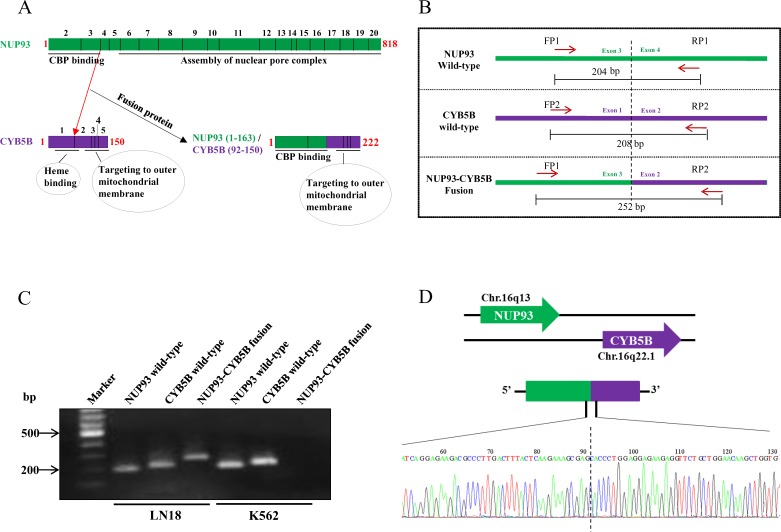
Figure 8. NUP93-CYB5B gene fusion validation.
A. Representative image of the protein structure of wild-type NUP93 and CYB5B and NUP93-CYB5B fusion product. The exons representing each section of the protein sequence has been represented by smaller boxes in the protein schematic and exon numbers (black) have been provided on top of the diagram. The amino acid length of each protein sequences have been denoted in red. B. Primer design for detecting wild type and fusion gene for NUP93-CYB5B. FP = Forward primer and RP = Reverse primer. C. Semi-quantitative PCR gel picture of amplicons derived from PCR of wild type NUP93 and CYB5B and NUP93-CYB5B fusion products in LN18 and K562. D.. Sanger sequencing chromatogram of the fusion junction region.

