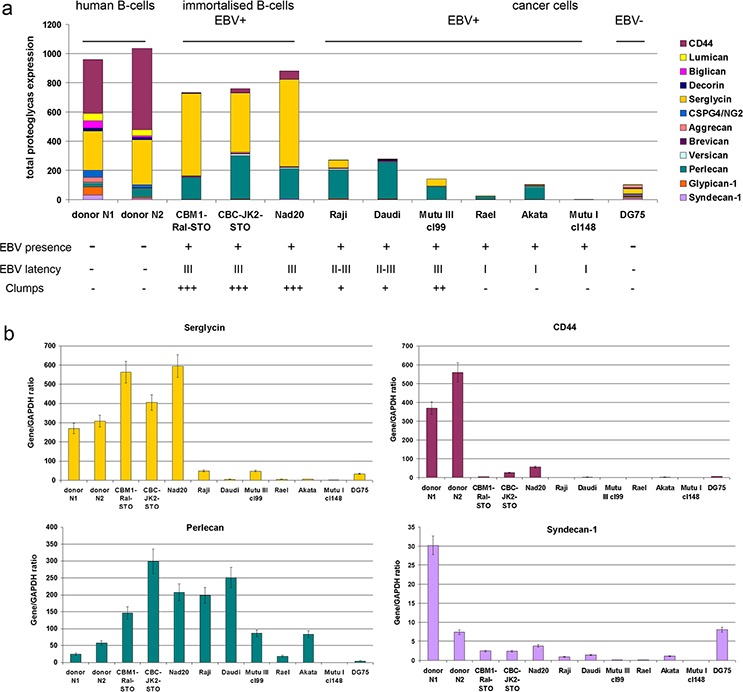
Figure 1. Proteoglycan expression in different normal and lymphoid cell lines.

a. Quantitative Real-Time RT-PCR. Intensity of the amplified DNA fragments for individual PGs normalized to that of GAPDH. Stacked column compares the contribution of each proteoglycan to the total PGs biosynthetic activity of the cells. b. Individual proteoglycans expression in the cell lines. The graph shows the mean expression levels from triplicate experiments (± SD) (OriginPro 8.1).
