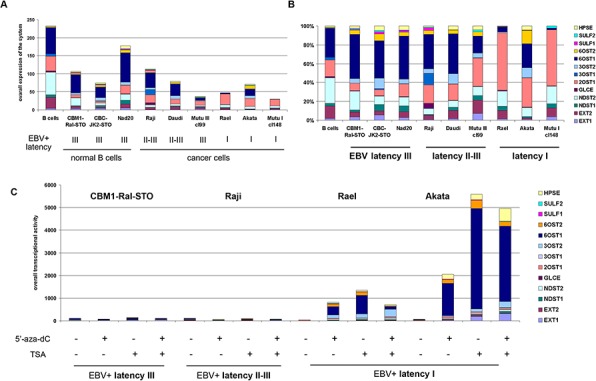
Figure 4. Expression of the HS biosynthetic system in primary B cells, LCLs and BL cells in different latency stages.

a. Quantitative Real-Time PCR. Intensity of the amplified DNA fragments for individual enzymes were normalized to that of GAPDH. Stacked column shows a comparison of the contribution of each enzyme to the total transcriptional activity of the HS biosynthetic system in each cell type. b. Qualitative structure of the expression of HS biosynthetic system. Expression rates for the individual genes were calculated as percentage of the total transcriptional activity of the system, set to 100%. c. Effects of 5′-aza-dC and TSA treatments on HS biosynthetic system transcriptional activity in LCL and BL cells in different latency stages.
