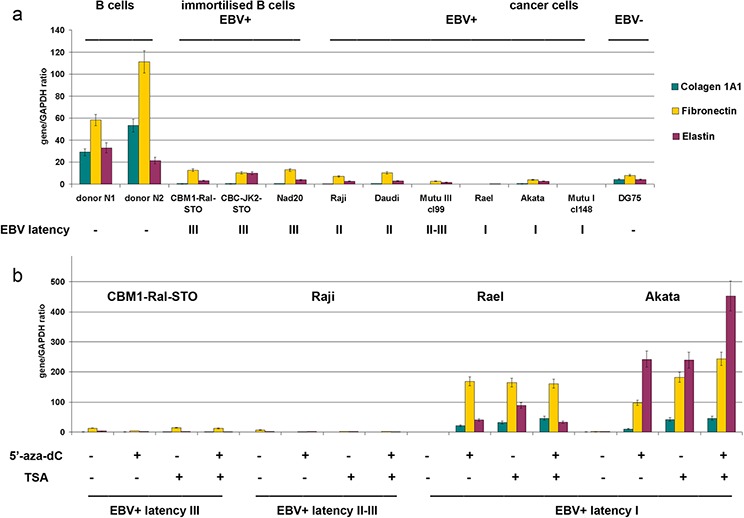
Figure 5. Expression of extracellular matrix components in primary B cells, LCLs and BL cells in different latency stages.

a. Quantitative Real-Time Q-PCR. Intensity of the amplified DNA fragments normalized to that of GAPDH. Bars represent the mean ± SD from triplicate experiments (OriginPro 8.1). b. Effects of 5′-aza-dC and TSA treatment on the HS biosynthetic system transcriptional activity in LCL and BL cells in different latency stages.
