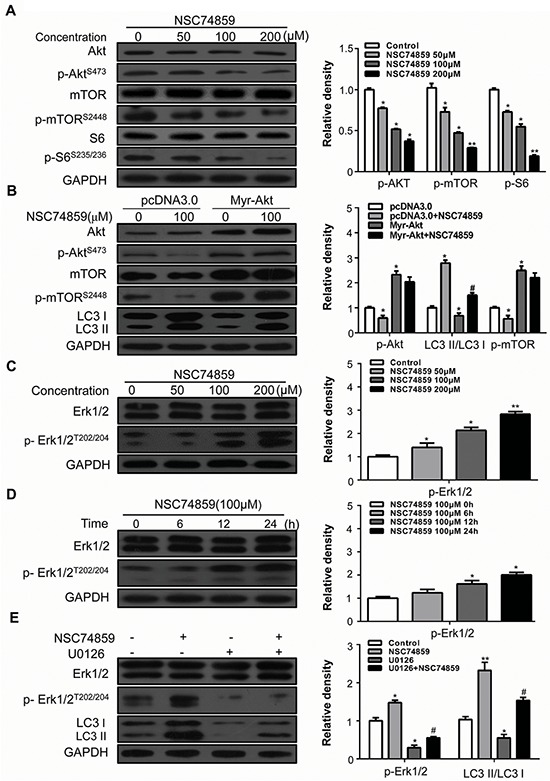
Figure 4. The Akt/mTOR and Erk signaling pathway are involved in NSC74859-induced autophagy in HNSCC cells.

A. CAL27 cells were treated with different concentration of NSC74859 for 24 h, the level of Akt, p-AktS473, mTOR, p-mTORS2448, S6 and p-S6S236/236 were analyzed by western blot in left part. Relative quantitative data were calculated by Image J in the right part; B. Western blotting of NSC74859-induced autophagy following the overexpression of a constitutively active form of Akt (Myr-Akt). Cells were transfected with an Akt overexpression (Myr-Akt) or empty vector (pcDNA3) plasmid for 24 hours and then treated with 100 μM of NSC74859 for 24 hours. Levels of Akt, p-AktS473, and LC3I/II were measured by western blotting. C. CAL27 cells were treated with different concentration of NSC74859 for 24 h, the level of Erk 1/2 and p-Erk 1/2T202/204 were analyzed by western blot in left part; Relative quantitative data were calculated by Image J in the right part; D. CAL27 cells were treated with100 μM of NSC74859 for 6, 12 and 24 h, then western blot was performed to analyze the protein Erk 1/2 and p-Erk 1/2T202/204; Relative quantitative data were calculated by Image J in the right part; E. CAL27 cells were treated with 100 μM of NSC74859 in the presence or absence of the Erk phosphorylation inhibitor U0126 (20 μM) for 24 h. The level of LC3I/II, Erk 1/2 and p-Erk 1/2T202/204 were determined by western blot analysis in left part. Relative quantitative data were calculated by Image J in the right part. *P < 0.05, **P < 0.01 versus the control group, One-way ANOVA with post-Dunett analysis was used by GraphPad Prism5, #P < 0.05 versus the NCS74859 (100 μM) group, One-way ANOVA with post-Tukey analysis was used by GraphPad Prism5.
