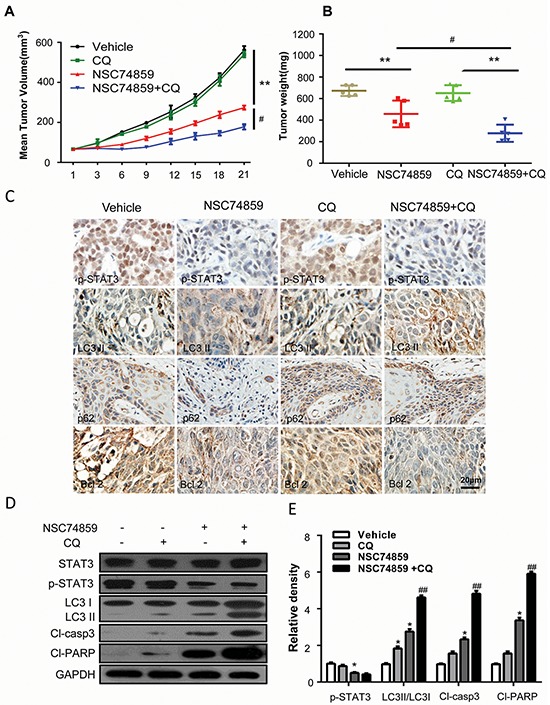
Figure 5. Targeting autophagy and STAT3 signaling blocks tumor growth in vivo.

A. Tumor growth curve of control (vehicle treated) mice, CQ-treated (250 mg/kg body weight) mice, NSC74859-treated (5 mg/kg body weight) mice and co-treatment with CQ (250 mg/kg body weight) and NSC74859 (5 mg/kg body weight) mice. Data represent the mean ± SEM of five mice in each group. **P < 0.01 versus the control group, #P < 0.05 versus the NCS74859 (5 mg/kg body weight) group by the Student t test. B. Dissected tumor was weighted. **P < 0.01 versus the control group, #P < 0.05 versus the NCS74859 (5 mg/kg body weight) group by the Student t test. C. Representative images of immunohistochemical analysis of p-STAT3T705, LC3, Bcl-2 and p62 in tumors. D. Western blots of p-STAT3T705, LC3, Cleaved-Caspase 3 (Cl-Casp 3) and cleaved-PARP (Cl-PARP) in tumor tissues. GAPDH was probed as the loading control. Densitometric values were quantified using the Image J software, and the data were presented as means ± SEM of three independent experiments. *P < 0.05, ** P < 0.01 versus the control group, one-way ANOVA with post-Dunett analysis was used by GraphPad Prism5; ##P < 0.01 versus the NCS74859 (100 μM) group, One-way ANOVA with post-Tukey analysis was used by GraphPad Prism5.
