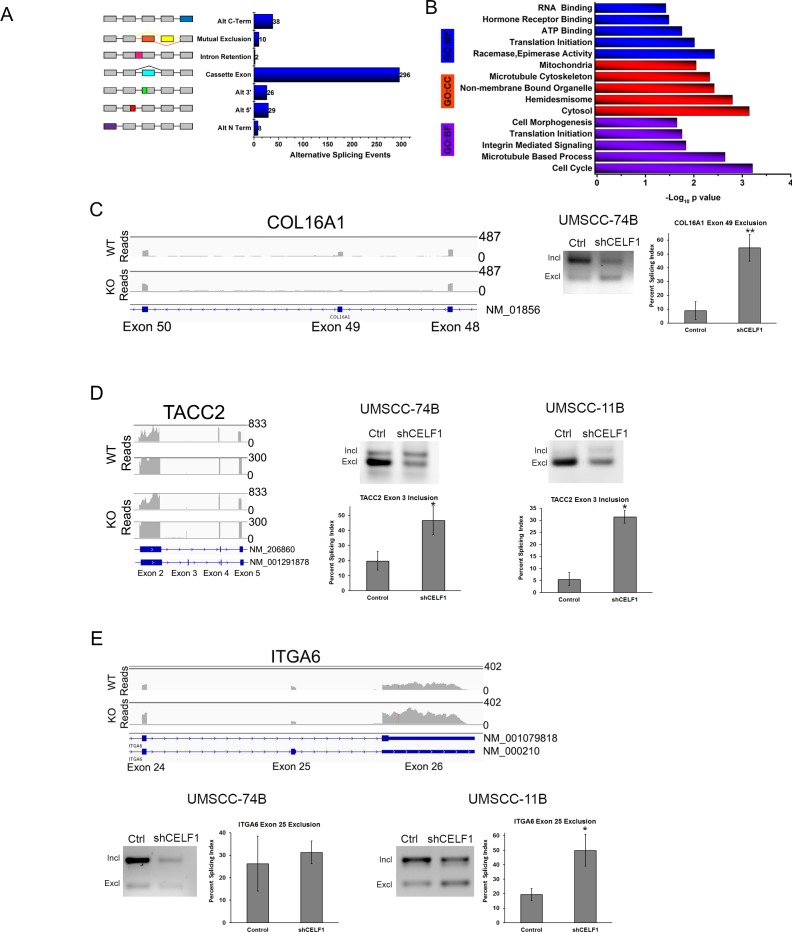
Figure 2. CELF1 protein expression affects alternative splicing.
A. Quantitation of CELF1 controlled alternative splicing events. B. Enrichment analysis of CELF1 regulated alternatively spliced genes. Illustration of alternative splicing of C. COL16A1 D. TACC2 E. ITGA6 using integrative genomics viewer. Numbers represent scale for transcript read counts. Scale for WT and KO reads are equivalent. Lower track represents zoomed in region for both TACC2 WT and KO reads. (Right) PCR agarose images of splicing events in UMSCC-74B and 11B oral cancer cells treated with control shRNA or CELF1 shRNA. Bar graph is quantitation of percent splicing index value. Data represented as mean ± SD; N = 3 **p value < 0.01; ***p value < 0.005.

