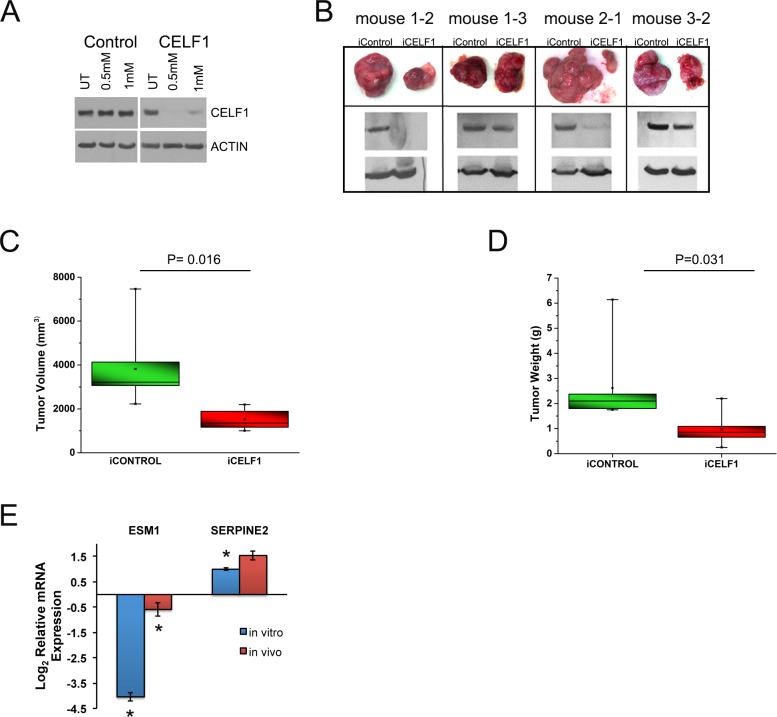
Figure 3. Reduction of CELF1 decreases tumor volume in vivo.
A. Western blot analysis of CELF1 protein expression day 6 post treatment of UMSCC-74B cells with 0.5mM and 1mM IPTG. B. Representative tumor images of four nude mice treated with 21mM IPTG/5% glucose in drinking water. N = 7 mice C. Quantitation of iCELF1 and iControl UMSCC-74B cell tumor volumes. N = 7; median (horizontal line); box (interquartile range); whiskers (minimum and maximum) mean (point inside box). D. Measurement of tumor weight. N = 7; median (horizontal line); box (interquartile range); whiskers (minimum and maximum) mean (point inside box). E. Quantitative real time PCR analysis of ESM1 and SERPINE2 mRNA levels in UMSCC-74B cells in culture and in xenograft tumors. Bars represent mean ± SE **p value < 0.05.

