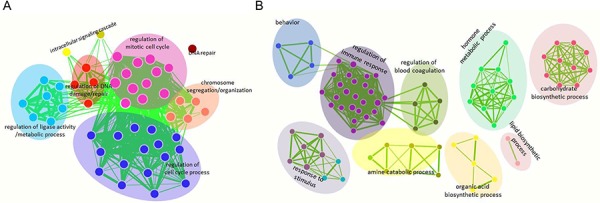
Figure 1. Functional enrichment maps of deregulated protein-coding genes in HCC.

The gene sets for GO terms were visualized using the Cytoscape Enrichment Map plugin. Each node represents a GO term. Node size is indicative of the number of genes in a set. The thickness of each line is indicative of the number of genes shared between the connected gene sets. The enriched gene sets of up-regulated protein-coding genes in HCC are shown in A. and the down-regulated protein-coding genes in HCC are shown in B.
