
Figure 15.
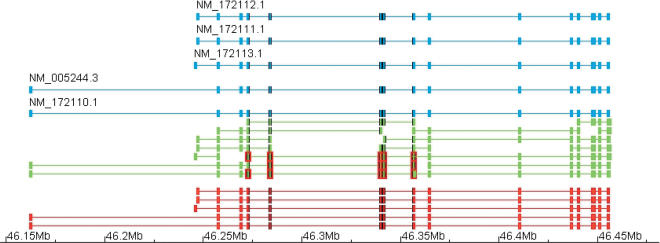
EYA2 gene locus. This figure shows the transcript predicted from the cDNA pieces on the EYA2 locus in chromosome 20. The aligned cDNAs are given in blue; the cDNA pieces, in green; and the predictions, in red. All the original cDNAs are recovered from the chunks. No chunk covered entirely any of the cDNAs. However, any two neighboring sites of alternative splicing were covered by at least one EST; hence, the global splicing information could be recovered by the algorithm. To improve clarity in the structure of the chunks, we have highlighted a set of those in the middle. Exons are highlighted in red and splice-sites in the original cDNAs, and the predicted transcripts are highlighted in black when they are coincident with the highlighted exons.