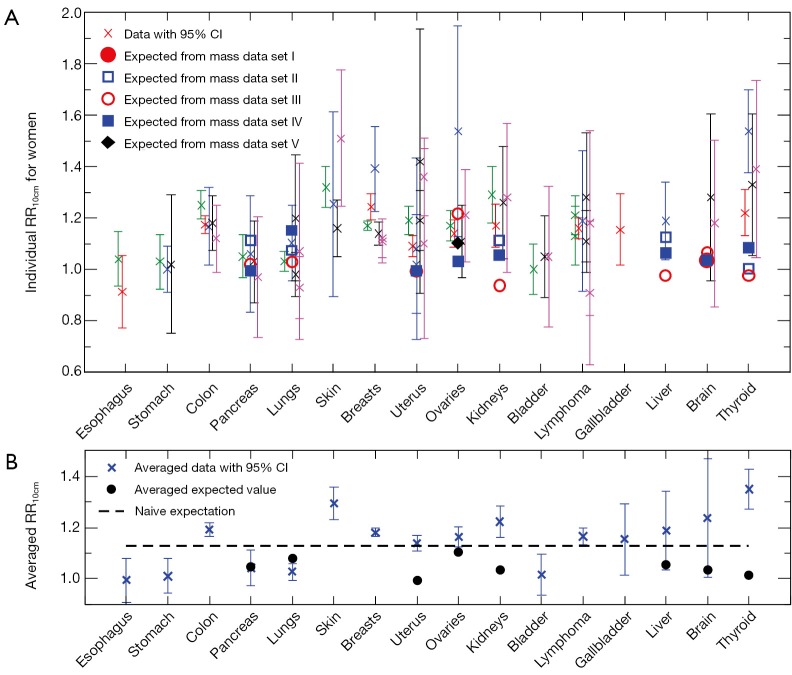
Figure 1.
Height dependence of cancer risk for women. (A) Individual cancer risk data (cross symbols) on RR10cm with 95% CIs for cancer sites of women in comparison with individual expected RR10cm values (other symbols) from different sets of the organ mass data. (B) Averaged cancer risk data (cross symbols) on RR10cm with 95% CIs for cancer sites of women in comparison with the averaged expected RR10cm values (circles) from the organ mass data. The dashed line represents the naive expectation of RR10cm if the mass of each organ would be proportional to the body weight at a fixed BMI. RR, relative risk; CI, confidence interval; BMI, body mass index.

