Figure 3.
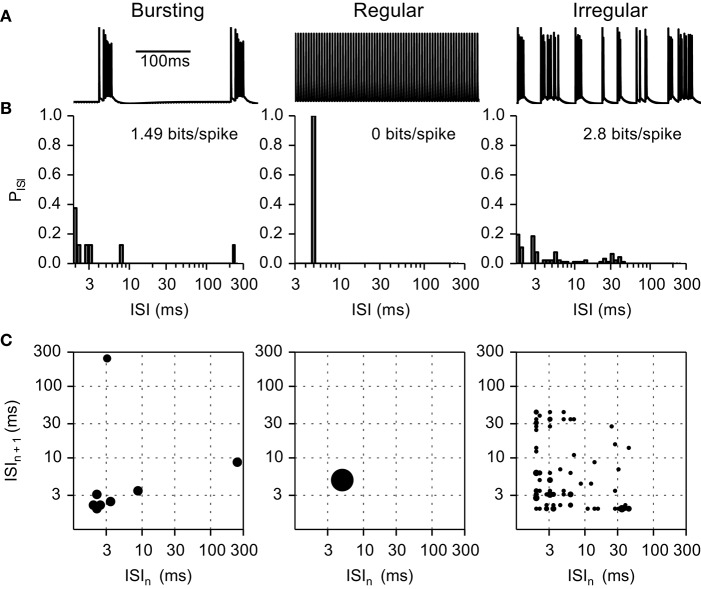
Example of inter-spike interval (ISI) histograms and ISI pair histograms for fibers exhibiting intrinsic bursting activity, regular firing, and irregular firing. (A) Transmembrane voltage in bursting, regular, and irregular firing model nerve fibers. (B) Histograms representing the probability of each ISI interval. (C) ISI pair maps illustrating the probability of an ISI pair. Larger circles represent higher probability. Bursting fibers (entropy 1.49 bits/spike) displayed peaks at short (intra-burst spikes) and at long (inter-burst spikes) ISIs; as compared to regular firing fibers (entropy 0 bits/spike) that displayed a single peak at the firing frequency in both the ISI histograms and the ISI pair histograms. Irregular fibers displayed very different firing patterns; in this example (entropy 2.8 bits/spike) the ISI histogram and ISI pair histograms are spread below 50 ms.

