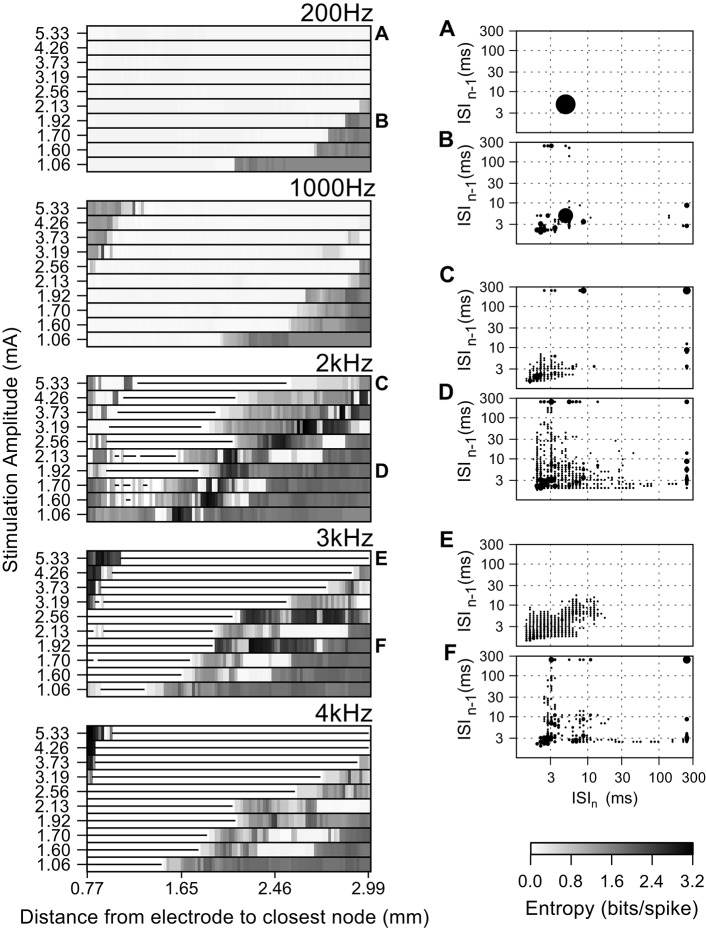
Figure 6.
Effect of the amplitude of the stimulating current on the firing pattern of model axons during high frequency extracellular stimulation. Entropy maps for multiple frequencies and current amplitudes (left), and population ISI pair histograms (right), i.e., from all fibers at a particular current amplitude. The area of each circle represents the probability of a given ISI being followed by another. The ISI pair histograms (A–F) correspond to the labels in the left panels and refer to: (A) The intrinsic activity was masked by extracellular stimulation in all fibers and replaced by entirely regular firing, thereby reducing the ISI pair histogram to a single circle. (B) Stimulation regularized firing in 50% of the fibers, but did not mask the intrinsic activity in the remaining fibers. (C–F) Irregular firing patterns evoked by high frequency stimulation. Stimulation amplitudes higher than 3.19 mA at frequencies above 1 kHz generated irregular activity patterns in the fibers closer to the electrode due to activation initiating at nodes further away from the electrode. In the entropy maps, the horizontal lines indicate fibers where the action potential conduction was blocked by extracellular stimulation.

