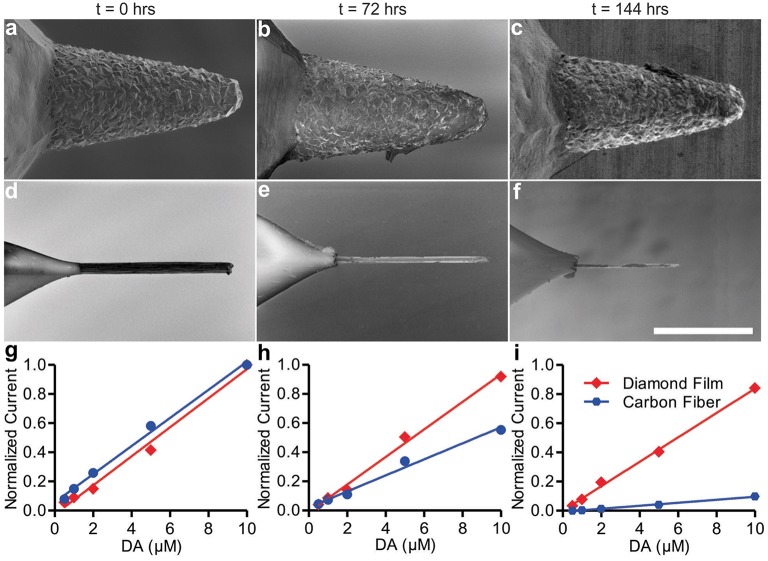
Figure 3.
SEM images of diamond electrode (A–C) and carbon fiber electrode (D–F). Panels (A,D) are at t = 0, panels (B,E) t = 72 h, and panels (C,F) are at t = 144 h. Panels (G–I) show diamond and carbon fiber calibration curves for the detection of dopamine at t = 0 h (G), t = 72 h (H), and t = 144 h (I) of continuous use.

