
FIGURE 3.
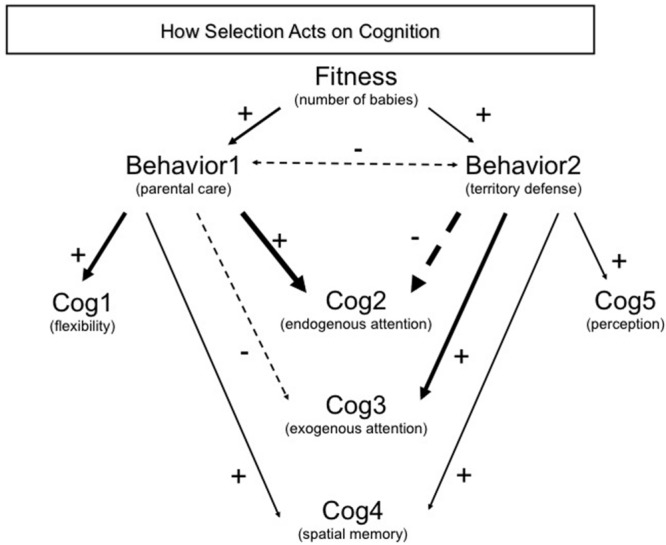
Mapping the relationship between traits and how selection acts on cognition: a path approach. Schematic example of a generic, hypothetical path analysis linking fitness (number of babies) that depends on two behaviors (parental care and territory defense), which in turn are dependent on a number of cognitive abilities. Arrows show the direction in which selection acts with solid arrows showing a positive relationship and dashed arrows a negative relationship and the thickness of arrows represents the strength of the relationship (partial correlation coefficient). Note that the direction opposite the arrows should indicate effects that underlie the above measure; for example, Cog1 plays an important role in the expression of Behav1. In this example, each behavior is linked to a number of cognitive abilities, but in different ways. Each behavior is linked to one cognitive ability that is only associated with that one behavior (Cog1 and Cog5), but also three other cognitive abilities that are also linked to both behaviors (Cog2–4). Cognitive traits that influence both behaviors show different patterns: attention (Cog 2, 3) shows opposite patterns between the two behaviors whereas memory (Cog4) has a positive relationship with both behaviors. The resulting selection and evolutionary dynamics will reflect these patterns: intense positive selection on memory, but more muted selection on attention. Path models can also estimate the relationship between traits such as the negative relationship we illustrate here as a double headed arrow (correlation with no causation implied) between parental care behavior and territory defense often thought to be antagonistic due to the effects of testosterone on each behavior.