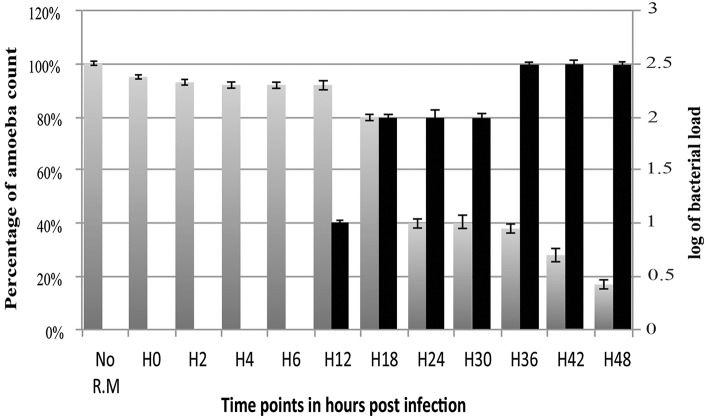
Figure 2.
Histogram of R. massiliensis cycle growth in V. vermiformis measured by real-time PCR. X-axis corresponds to the cycle time points in hours (from 0 to 48 h). No R.M corresponds to the negative control, which is the non-infected amoeba). Y-axis to the right corresponds to the log of bacterial load (the log values are obtained after conversion of the Cycle threshold (Ct.) values based on standard curves realized with serial 1: 10 dilution starting with 107 bacterial particles). Y-axis to the left corresponds to the percentage of amoeba concentrations quantified on kovaslides. This relative quantification by real-time PCR showed the increase in bacterial multiplication coming along with the decrease of the amoeba concentration. No bacterial DNA was detected from H0 till H6. Bacterial titers begin to be detected at H12 p.i, Higher titers are from H18 till H30 with a plateau from H36 until H48 p.i.

