
FIGURE 3.
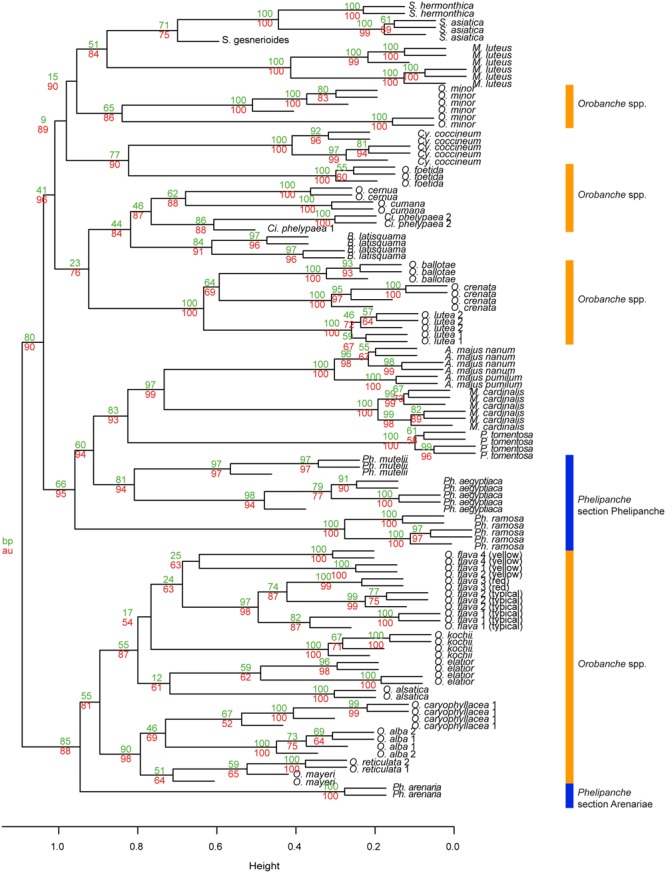
Hierarchical clustering diagram of the flower VOC profiles of 32 species studied. HCA was performed with R and based on PCA of significantly different flower blends. Numbers at nodes are bootstrap probability P-value (BP, upper green numbers) and approximately unbiased P-values (AU, lower red numbers). The definition of the two genera of Orobanche is designated in orange (genus Orobanche) and blue (genus Phelipanche) bar; section Arenariae is also indicated (subsections within genus Orobanche are shown in Figure 6).