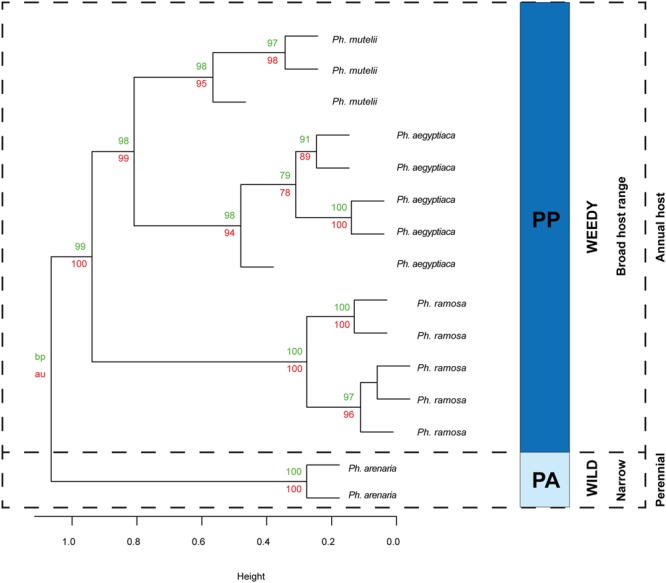
FIGURE 7.

Hierarchical clustering diagram of the flower VOC profiles of all broomrapes of the genus Phelipanche. HCA was performed with R and it was based on recalculated PCA using a subset with data of Phelipanche spp. only. Numbers at nodes are bootstrap probability P-value (BP, upper green numbers) and approximately unbiased P-values (AU, lower red numbers). Taxonomic grouping of the genus Phelipanche as proposed by Teryokhin (1997) is shown by letters and colors which indicate sections, PP, Phelipanche and PA, Arenariae.
