Figure 3.
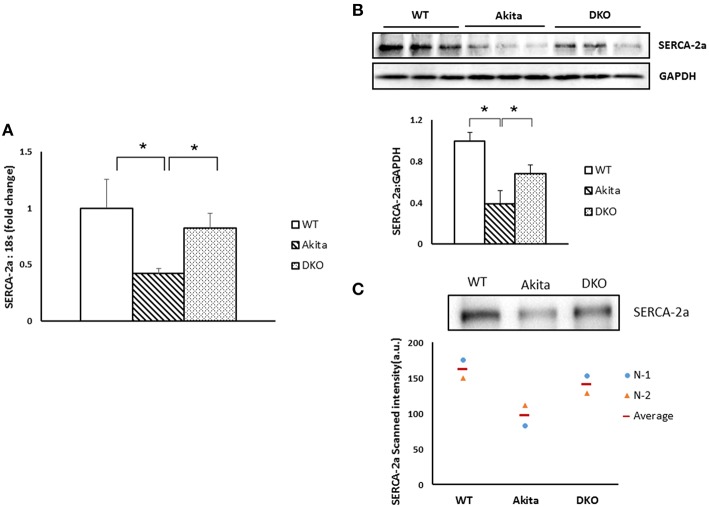
Deletion of MMP9 gene increased the levels of SERCA-2a in diabetic hearts. (A) QPCR showing the mRNA levels of SERCA-2a in WT, Akita, and DKO hearts. Values are mean ± SEM. N = 5, *P < 0.05. (B) Top, representative Western blot bands for SERCA-2a and GAPDH (a loading control). Bottom, bar graph showing densitometric analyses of SERCA-2a band intensity. N = 3. Values are mean ± SEM. *P < 0.05. (C) Top, representative immunoprecipitation bands for SERCA-2a. Bar graphs showing relative expression of SERCA-2a in the three groups. Bottom, bar graph showing the relative values of densitometric band intensity (arbitrary unit, a. u.) N = 2.

