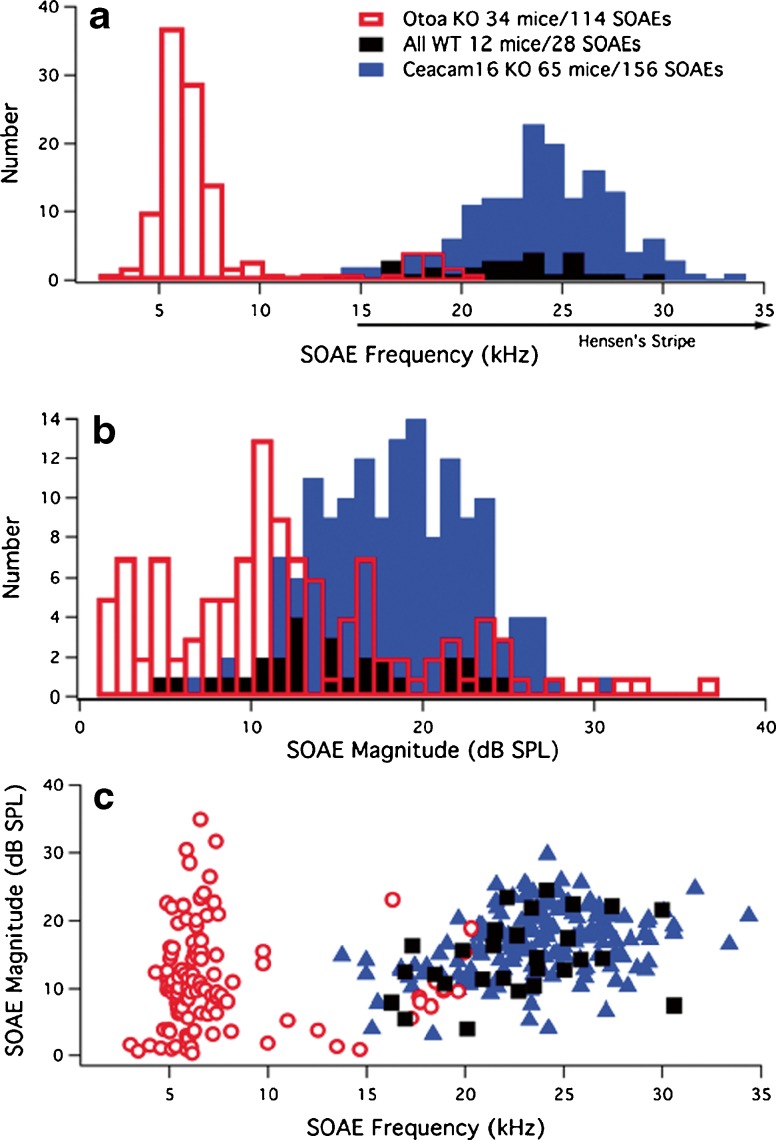
Fig. 3.
SOAE frequencies and magnitudes. The number of SOAEs is plotted as a function of their peak frequency (A) and magnitude (B). The total number of mice with SOAEs and the total number of SOAEs observed in each mouse group is provided in the legend. The position of Hensen’s stripe in WT mice is also indicated in panel A along the abscissa to show that it is present in controls but only for more basal locations encoding frequencies greater than ~15 kHz (Cheatham et al. 2014; Legan et al. 2014). Panel C provides a plot of SOAE magnitude versus SOAE frequency for WT (black squares), Ceacam16 KOs (blue triangles), and Otoa KOs (red open circles).

